Sioux vs Immigrants from Northern Europe Female Poverty Among 18-24 Year Olds
COMPARE
Sioux
Immigrants from Northern Europe
Female Poverty Among 18-24 Year Olds
Female Poverty Among 18-24 Year Olds Comparison
Sioux
Immigrants from Northern Europe
28.6%
FEMALE POVERTY AMONG 18-24 YEAR OLDS
0.0/ 100
METRIC RATING
340th/ 347
METRIC RANK
19.4%
FEMALE POVERTY AMONG 18-24 YEAR OLDS
95.4/ 100
METRIC RATING
120th/ 347
METRIC RANK
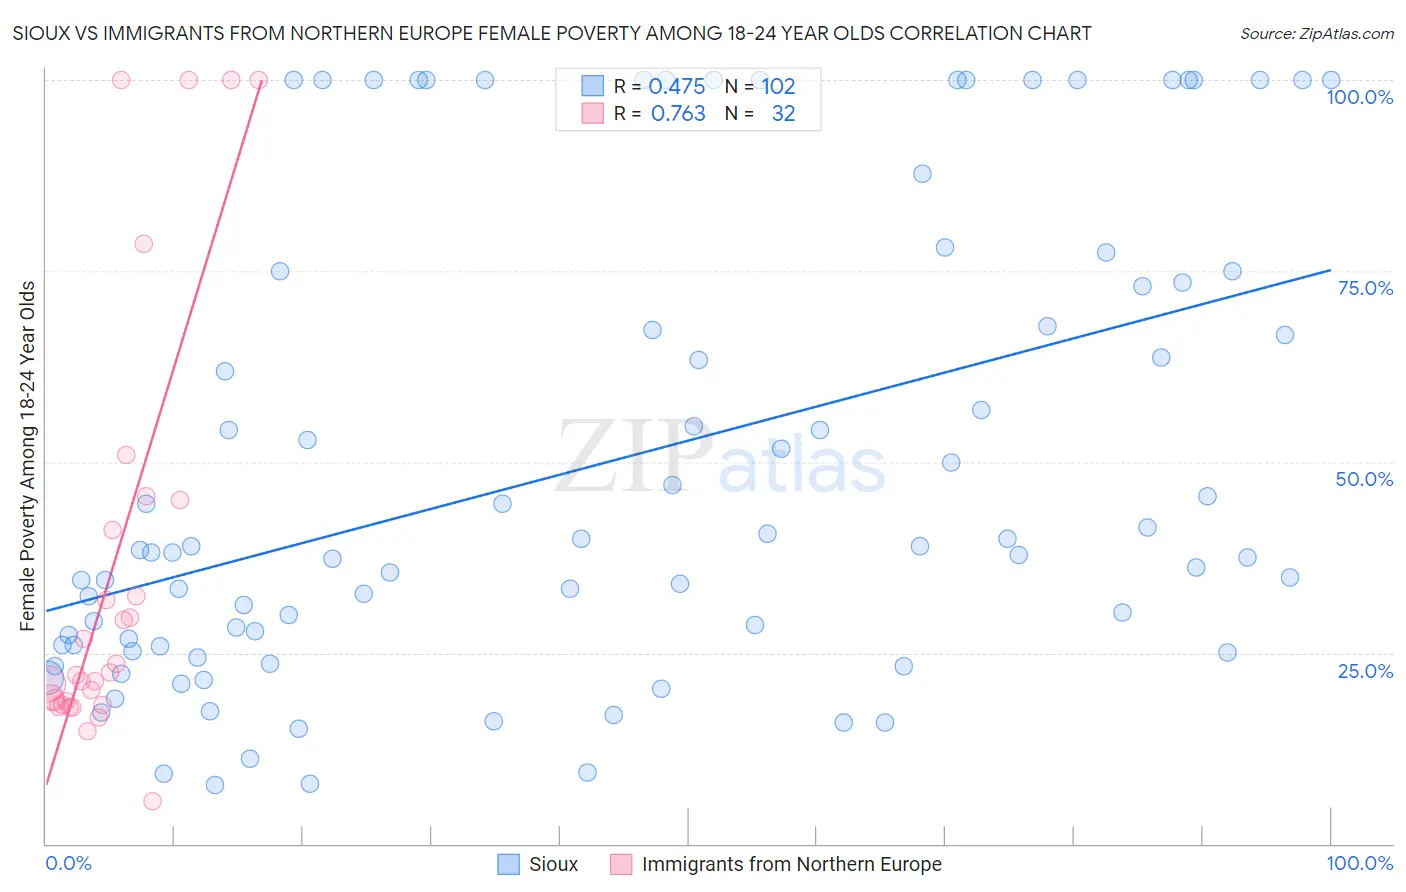
Sioux vs Immigrants from Northern Europe Female Poverty Among 18-24 Year Olds Correlation Chart
The statistical analysis conducted on geographies consisting of 230,923,136 people shows a moderate positive correlation between the proportion of Sioux and poverty level among females between the ages 18 and 24 in the United States with a correlation coefficient (R) of 0.475 and weighted average of 28.6%. Similarly, the statistical analysis conducted on geographies consisting of 458,376,761 people shows a strong positive correlation between the proportion of Immigrants from Northern Europe and poverty level among females between the ages 18 and 24 in the United States with a correlation coefficient (R) of 0.763 and weighted average of 19.4%, a difference of 47.6%.
Female Poverty Among 18-24 Year Olds Correlation Summary
| Measurement | Sioux | Immigrants from Northern Europe |
| Minimum | 7.7% | 5.6% |
| Maximum | 100.0% | 100.0% |
| Range | 92.3% | 94.4% |
| Mean | 49.6% | 35.8% |
| Median | 38.3% | 22.3% |
| Interquartile 25% (IQ1) | 26.1% | 18.4% |
| Interquartile 75% (IQ3) | 73.5% | 43.0% |
| Interquartile Range (IQR) | 47.4% | 24.6% |
| Standard Deviation (Sample) | 30.2% | 28.1% |
| Standard Deviation (Population) | 30.0% | 27.7% |
Similar Demographics by Female Poverty Among 18-24 Year Olds
Demographics Similar to Sioux by Female Poverty Among 18-24 Year Olds
In terms of female poverty among 18-24 year olds, the demographic groups most similar to Sioux are Pima (28.4%, a difference of 0.55%), Hopi (28.2%, a difference of 1.3%), Cheyenne (28.1%, a difference of 1.5%), Colville (29.0%, a difference of 1.6%), and Kiowa (29.2%, a difference of 2.3%).
| Demographics | Rating | Rank | Female Poverty Among 18-24 Year Olds |
| Apache | 0.0 /100 | #333 | Tragic 26.3% |
| Pueblo | 0.0 /100 | #334 | Tragic 26.9% |
| Yup'ik | 0.0 /100 | #335 | Tragic 27.0% |
| Immigrants | Yemen | 0.0 /100 | #336 | Tragic 27.5% |
| Cheyenne | 0.0 /100 | #337 | Tragic 28.1% |
| Hopi | 0.0 /100 | #338 | Tragic 28.2% |
| Pima | 0.0 /100 | #339 | Tragic 28.4% |
| Sioux | 0.0 /100 | #340 | Tragic 28.6% |
| Colville | 0.0 /100 | #341 | Tragic 29.0% |
| Kiowa | 0.0 /100 | #342 | Tragic 29.2% |
| Puerto Ricans | 0.0 /100 | #343 | Tragic 29.8% |
| Navajo | 0.0 /100 | #344 | Tragic 30.3% |
| Tohono O'odham | 0.0 /100 | #345 | Tragic 31.0% |
| Lumbee | 0.0 /100 | #346 | Tragic 31.1% |
| Crow | 0.0 /100 | #347 | Tragic 33.2% |
Demographics Similar to Immigrants from Northern Europe by Female Poverty Among 18-24 Year Olds
In terms of female poverty among 18-24 year olds, the demographic groups most similar to Immigrants from Northern Europe are Guyanese (19.4%, a difference of 0.020%), Cypriot (19.3%, a difference of 0.040%), Immigrants from Guyana (19.3%, a difference of 0.060%), Immigrants from Iran (19.3%, a difference of 0.12%), and Immigrants (19.3%, a difference of 0.15%).
| Demographics | Rating | Rank | Female Poverty Among 18-24 Year Olds |
| Immigrants | Cameroon | 96.3 /100 | #113 | Exceptional 19.3% |
| Slovenes | 96.2 /100 | #114 | Exceptional 19.3% |
| Immigrants | Hungary | 96.2 /100 | #115 | Exceptional 19.3% |
| Immigrants | Immigrants | 95.9 /100 | #116 | Exceptional 19.3% |
| Immigrants | Iran | 95.8 /100 | #117 | Exceptional 19.3% |
| Immigrants | Guyana | 95.6 /100 | #118 | Exceptional 19.3% |
| Cypriots | 95.5 /100 | #119 | Exceptional 19.3% |
| Immigrants | Northern Europe | 95.4 /100 | #120 | Exceptional 19.4% |
| Guyanese | 95.3 /100 | #121 | Exceptional 19.4% |
| Cambodians | 94.6 /100 | #122 | Exceptional 19.4% |
| Paraguayans | 94.6 /100 | #123 | Exceptional 19.4% |
| Immigrants | Chile | 94.3 /100 | #124 | Exceptional 19.4% |
| Immigrants | Panama | 94.0 /100 | #125 | Exceptional 19.4% |
| Immigrants | Russia | 93.7 /100 | #126 | Exceptional 19.4% |
| Cape Verdeans | 93.6 /100 | #127 | Exceptional 19.4% |