Sierra Leonean vs Yup'ik Single Father Poverty
COMPARE
Sierra Leonean
Yup'ik
Single Father Poverty
Single Father Poverty Comparison
Sierra Leoneans
Yup'ik
17.2%
SINGLE FATHER POVERTY
0.8/ 100
METRIC RATING
255th/ 347
METRIC RANK
32.5%
SINGLE FATHER POVERTY
0.0/ 100
METRIC RATING
347th/ 347
METRIC RANK
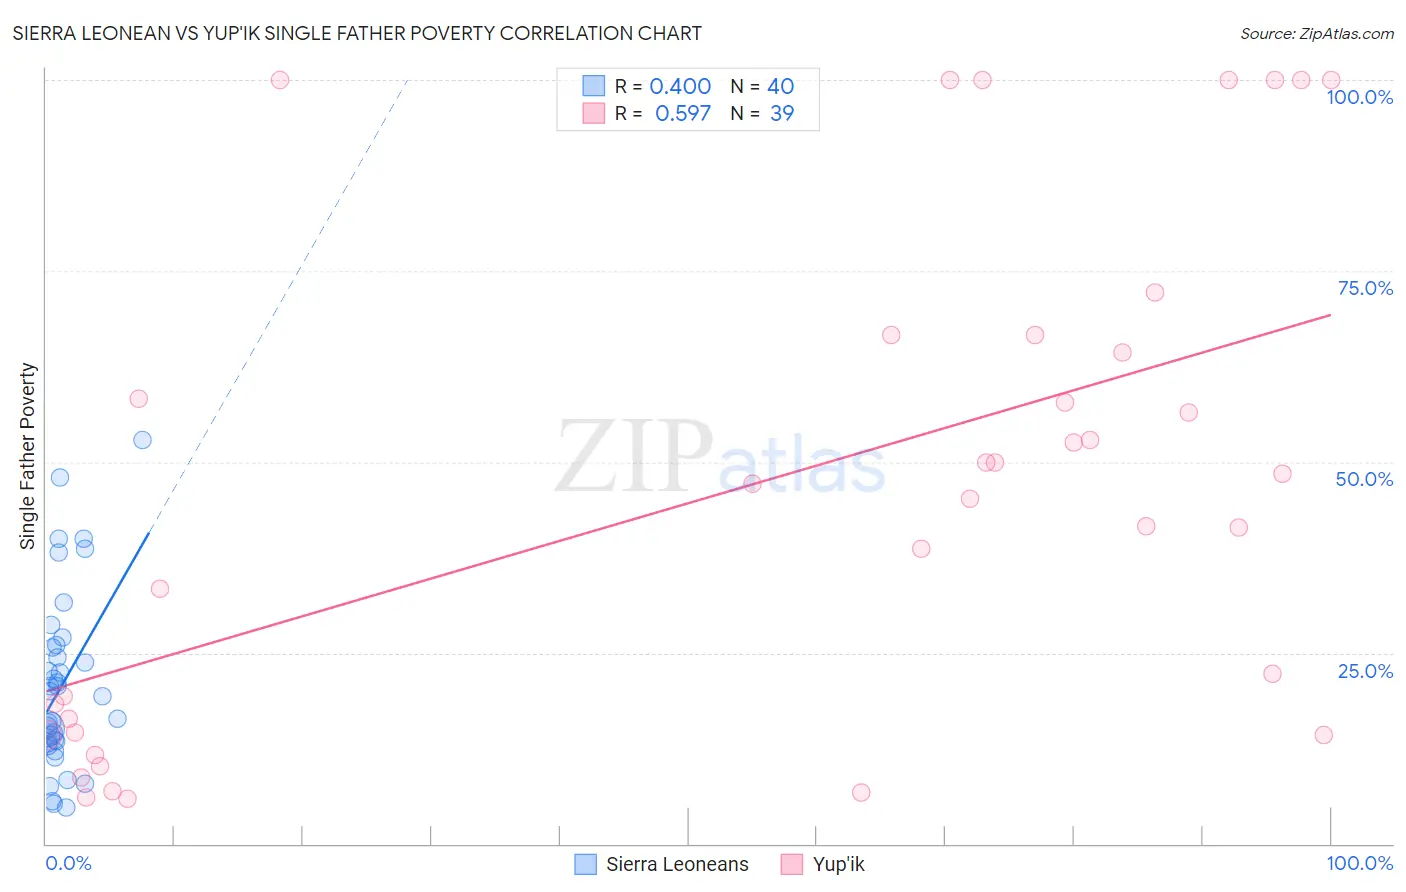
Sierra Leonean vs Yup'ik Single Father Poverty Correlation Chart
The statistical analysis conducted on geographies consisting of 77,262,166 people shows a mild positive correlation between the proportion of Sierra Leoneans and poverty level among single fathers in the United States with a correlation coefficient (R) of 0.400 and weighted average of 17.2%. Similarly, the statistical analysis conducted on geographies consisting of 37,532,100 people shows a substantial positive correlation between the proportion of Yup'ik and poverty level among single fathers in the United States with a correlation coefficient (R) of 0.597 and weighted average of 32.5%, a difference of 89.4%.
Single Father Poverty Correlation Summary
| Measurement | Sierra Leonean | Yup'ik |
| Minimum | 4.8% | 5.9% |
| Maximum | 52.9% | 100.0% |
| Range | 48.2% | 94.1% |
| Mean | 20.9% | 46.6% |
| Median | 19.7% | 47.1% |
| Interquartile 25% (IQ1) | 13.4% | 14.6% |
| Interquartile 75% (IQ3) | 25.9% | 66.7% |
| Interquartile Range (IQR) | 12.5% | 52.0% |
| Standard Deviation (Sample) | 11.6% | 32.1% |
| Standard Deviation (Population) | 11.5% | 31.7% |
Similar Demographics by Single Father Poverty
Demographics Similar to Sierra Leoneans by Single Father Poverty
In terms of single father poverty, the demographic groups most similar to Sierra Leoneans are Immigrants from Haiti (17.2%, a difference of 0.010%), Immigrants from Albania (17.2%, a difference of 0.090%), Albanian (17.2%, a difference of 0.11%), Immigrants from Jamaica (17.2%, a difference of 0.14%), and Immigrants from Honduras (17.1%, a difference of 0.17%).
| Demographics | Rating | Rank | Single Father Poverty |
| Czechoslovakians | 1.3 /100 | #248 | Tragic 17.1% |
| Canadians | 1.3 /100 | #249 | Tragic 17.1% |
| Austrians | 1.1 /100 | #250 | Tragic 17.1% |
| Luxembourgers | 1.1 /100 | #251 | Tragic 17.1% |
| Croatians | 1.0 /100 | #252 | Tragic 17.1% |
| Cree | 1.0 /100 | #253 | Tragic 17.1% |
| Immigrants | Honduras | 0.9 /100 | #254 | Tragic 17.1% |
| Sierra Leoneans | 0.8 /100 | #255 | Tragic 17.2% |
| Immigrants | Haiti | 0.8 /100 | #256 | Tragic 17.2% |
| Immigrants | Albania | 0.7 /100 | #257 | Tragic 17.2% |
| Albanians | 0.7 /100 | #258 | Tragic 17.2% |
| Immigrants | Jamaica | 0.7 /100 | #259 | Tragic 17.2% |
| Spaniards | 0.6 /100 | #260 | Tragic 17.2% |
| Swiss | 0.5 /100 | #261 | Tragic 17.3% |
| Immigrants | Zaire | 0.4 /100 | #262 | Tragic 17.3% |
Demographics Similar to Yup'ik by Single Father Poverty
In terms of single father poverty, the demographic groups most similar to Yup'ik are Puerto Rican (31.5%, a difference of 3.2%), Crow (30.3%, a difference of 7.4%), Navajo (29.2%, a difference of 11.3%), Lumbee (28.5%, a difference of 14.2%), and Yuman (28.4%, a difference of 14.6%).
| Demographics | Rating | Rank | Single Father Poverty |
| Natives/Alaskans | 0.0 /100 | #333 | Tragic 22.4% |
| Kiowa | 0.0 /100 | #334 | Tragic 22.5% |
| Shoshone | 0.0 /100 | #335 | Tragic 22.9% |
| Cajuns | 0.0 /100 | #336 | Tragic 23.1% |
| Sioux | 0.0 /100 | #337 | Tragic 23.9% |
| Arapaho | 0.0 /100 | #338 | Tragic 24.0% |
| Apache | 0.0 /100 | #339 | Tragic 24.2% |
| Houma | 0.0 /100 | #340 | Tragic 26.7% |
| Hopi | 0.0 /100 | #341 | Tragic 27.2% |
| Yuman | 0.0 /100 | #342 | Tragic 28.4% |
| Lumbee | 0.0 /100 | #343 | Tragic 28.5% |
| Navajo | 0.0 /100 | #344 | Tragic 29.2% |
| Crow | 0.0 /100 | #345 | Tragic 30.3% |
| Puerto Ricans | 0.0 /100 | #346 | Tragic 31.5% |
| Yup'ik | 0.0 /100 | #347 | Tragic 32.5% |