Sierra Leonean vs Immigrants from Africa Single Mother Poverty

COMPARE

Sierra Leonean
Race
Ancestry
AfghanAfricanAlaska NativeAlaskan AthabascanAlbanianAleutAlsatianAmericanApacheArabArapahoArgentineanArmenianAssyrian/Chaldean/SyriacAustralianAustrianBahamianBangladeshiBarbadianBasqueBelgianBelizeanBermudanBhutaneseBlackfeetBolivianBrazilianBritishBritish West IndianBulgarianBurmeseCajunCambodianCanadianCape VerdeanCarpatho RusynCelticCentral AmericanCentral American IndianCherokeeCheyenneChickasawChileanChineseChippewaChoctawColombianColvilleComancheCosta RicanCreeCreekCroatianCrowCubanCypriotCzechCzechoslovakianDanishDelawareDominicanDutchDutch West IndianEastern EuropeanEcuadorianEgyptianEnglishEstonianEthiopianEuropeanFijianFilipinoFinnishFrenchFrench American IndianFrench CanadianGermanGerman RussianGhanaianGreekGuamanian/ChamorroGuatemalanGuyaneseHaitianHmongHonduranHopiHoumaHungarianIcelanderIndian (Asian)IndonesianInupiatIranianIraqiIrishIroquoisIsraeliItalianJamaicanJapaneseJordanianKenyanKiowaKoreanLaotianLatvianLebaneseLiberianLithuanianLumbeeLuxembourgerMacedonianMalaysianMalteseMarshalleseMenomineeMexicanMexican American IndianMongolianMoroccanNative HawaiianNavajoNepaleseNew ZealanderNicaraguanNigerianNorthern EuropeanNorwegianOkinawanOsageOttawaPaiutePakistaniPalestinianPanamanianParaguayanPennsylvania GermanPeruvianPimaPolishPortuguesePotawatomiPuebloPuerto RicanPuget Sound SalishRomanianRussianSalvadoranSamoanScandinavianScotch-IrishScottishSeminoleSenegaleseSerbianShoshoneSierra LeoneanSiouxSlavicSlovakSloveneSomaliSouth AfricanSouth AmericanSouth American IndianSoviet UnionSpaniardSpanishSpanish AmericanSpanish American IndianSri LankanSubsaharan AfricanSudaneseSwedishSwissSyrianTaiwaneseThaiTlingit-HaidaTohono O'OdhamTonganTrinidadian and TobagonianTsimshianTurkishU.S. Virgin IslanderUgandanUkrainianUruguayanUteVenezuelanVietnameseWelshWest IndianYakamaYaquiYugoslavianYumanYup'ikZimbabwean
Immigration
NonimmigrantsImmigrantsAfghanistanAlbaniaArgentinaArmeniaAsiaAustraliaAustriaBahamasBangladeshBarbadosBelarusBelgiumBelizeBoliviaBosnia and HerzegovinaBrazilBulgariaBurma/MyanmarCabo VerdeCambodiaCameroonCanadaCaribbeanCentral AmericaChileChinaColombiaCongoCosta RicaCroatiaCubaCzechoslovakiaDenmarkDominicaDominican RepublicEastern AfricaEastern AsiaEastern EuropeEcuadorEgyptEl SalvadorEnglandEritreaEthiopiaEuropeFijiFranceGermanyGhanaGreeceGrenadaGuatemalaGuyanaHaitiHondurasHong KongHungaryIndiaIndonesiaIranIraqIrelandIsraelItalyJamaicaJapanJordanKazakhstanKenyaKoreaKuwaitLaosLatin AmericaLatviaLebanonLiberiaLithuaniaMalaysiaMexicoMicronesiaMiddle AfricaMoldovaMoroccoNepalNetherlandsNicaraguaNigeriaNorth AmericaNorth MacedoniaNorthern AfricaNorthern EuropeNorwayOceaniaPakistanPanamaPeruPhilippinesPolandPortugalRomaniaRussiaSaudi ArabiaScotlandSenegalSerbiaSierra LeoneSingaporeSomaliaSouth AfricaSouth AmericaSouth Central AsiaSouth Eastern AsiaSouthern EuropeSpainSri LankaSt. Vincent and the GrenadinesSudanSwedenSwitzerlandSyriaTaiwanThailandTrinidad and TobagoTurkeyUgandaUkraineUruguayUzbekistanVenezuelaVietnamWest IndiesWestern AfricaWestern AsiaWestern EuropeYemenZaireZimbabweAzores
Immigrants from Africa
Race
Ancestry
AfghanAfricanAlaska NativeAlaskan AthabascanAlbanianAleutAlsatianAmericanApacheArabArapahoArgentineanArmenianAssyrian/Chaldean/SyriacAustralianAustrianBahamianBangladeshiBarbadianBasqueBelgianBelizeanBermudanBhutaneseBlackfeetBolivianBrazilianBritishBritish West IndianBulgarianBurmeseCajunCambodianCanadianCape VerdeanCarpatho RusynCelticCentral AmericanCentral American IndianCherokeeCheyenneChickasawChileanChineseChippewaChoctawColombianColvilleComancheCosta RicanCreeCreekCroatianCrowCubanCypriotCzechCzechoslovakianDanishDelawareDominicanDutchDutch West IndianEastern EuropeanEcuadorianEgyptianEnglishEstonianEthiopianEuropeanFijianFilipinoFinnishFrenchFrench American IndianFrench CanadianGermanGerman RussianGhanaianGreekGuamanian/ChamorroGuatemalanGuyaneseHaitianHmongHonduranHopiHoumaHungarianIcelanderIndian (Asian)IndonesianInupiatIranianIraqiIrishIroquoisIsraeliItalianJamaicanJapaneseJordanianKenyanKiowaKoreanLaotianLatvianLebaneseLiberianLithuanianLumbeeLuxembourgerMacedonianMalaysianMalteseMarshalleseMenomineeMexicanMexican American IndianMongolianMoroccanNative HawaiianNavajoNepaleseNew ZealanderNicaraguanNigerianNorthern EuropeanNorwegianOkinawanOsageOttawaPaiutePakistaniPalestinianPanamanianParaguayanPennsylvania GermanPeruvianPimaPolishPortuguesePotawatomiPuebloPuerto RicanPuget Sound SalishRomanianRussianSalvadoranSamoanScandinavianScotch-IrishScottishSeminoleSenegaleseSerbianShoshoneSiouxSlavicSlovakSloveneSomaliSouth AfricanSouth AmericanSouth American IndianSoviet UnionSpaniardSpanishSpanish AmericanSpanish American IndianSri LankanSubsaharan AfricanSudaneseSwedishSwissSyrianTaiwaneseThaiTlingit-HaidaTohono O'OdhamTonganTrinidadian and TobagonianTsimshianTurkishU.S. Virgin IslanderUgandanUkrainianUruguayanUteVenezuelanVietnameseWelshWest IndianYakamaYaquiYugoslavianYumanYup'ikZimbabwean
Immigration
NonimmigrantsImmigrantsAfghanistanAfricaAlbaniaArgentinaArmeniaAsiaAustraliaAustriaBahamasBangladeshBarbadosBelarusBelgiumBelizeBoliviaBosnia and HerzegovinaBrazilBulgariaBurma/MyanmarCabo VerdeCambodiaCameroonCanadaCaribbeanCentral AmericaChileChinaColombiaCongoCosta RicaCroatiaCubaCzechoslovakiaDenmarkDominicaDominican RepublicEastern AfricaEastern AsiaEastern EuropeEcuadorEgyptEl SalvadorEnglandEritreaEthiopiaEuropeFijiFranceGermanyGhanaGreeceGrenadaGuatemalaGuyanaHaitiHondurasHong KongHungaryIndiaIndonesiaIranIraqIrelandIsraelItalyJamaicaJapanJordanKazakhstanKenyaKoreaKuwaitLaosLatin AmericaLatviaLebanonLiberiaLithuaniaMalaysiaMexicoMicronesiaMiddle AfricaMoldovaMoroccoNepalNetherlandsNicaraguaNigeriaNorth AmericaNorth MacedoniaNorthern AfricaNorthern EuropeNorwayOceaniaPakistanPanamaPeruPhilippinesPolandPortugalRomaniaRussiaSaudi ArabiaScotlandSenegalSerbiaSierra LeoneSingaporeSomaliaSouth AfricaSouth AmericaSouth Central AsiaSouth Eastern AsiaSouthern EuropeSpainSri LankaSt. Vincent and the GrenadinesSudanSwedenSwitzerlandSyriaTaiwanThailandTrinidad and TobagoTurkeyUgandaUkraineUruguayUzbekistanVenezuelaVietnamWest IndiesWestern AfricaWestern AsiaWestern EuropeYemenZaireZimbabweAzores
Single Mother Poverty
Income
Poverty
Unemployment
Labor Participation
Family Structure
Vehicle Availability
Education Level
Disability

Single Mother Poverty Comparison

Sierra Leoneans

Immigrants from Africa

Exceptional
Fair
27.4%
SINGLE MOTHER POVERTY
99.3/ 100
METRIC RATING
73rd/ 347
METRIC RANK
29.4%
SINGLE MOTHER POVERTY
31.6/ 100
METRIC RATING
189th/ 347
METRIC RANK

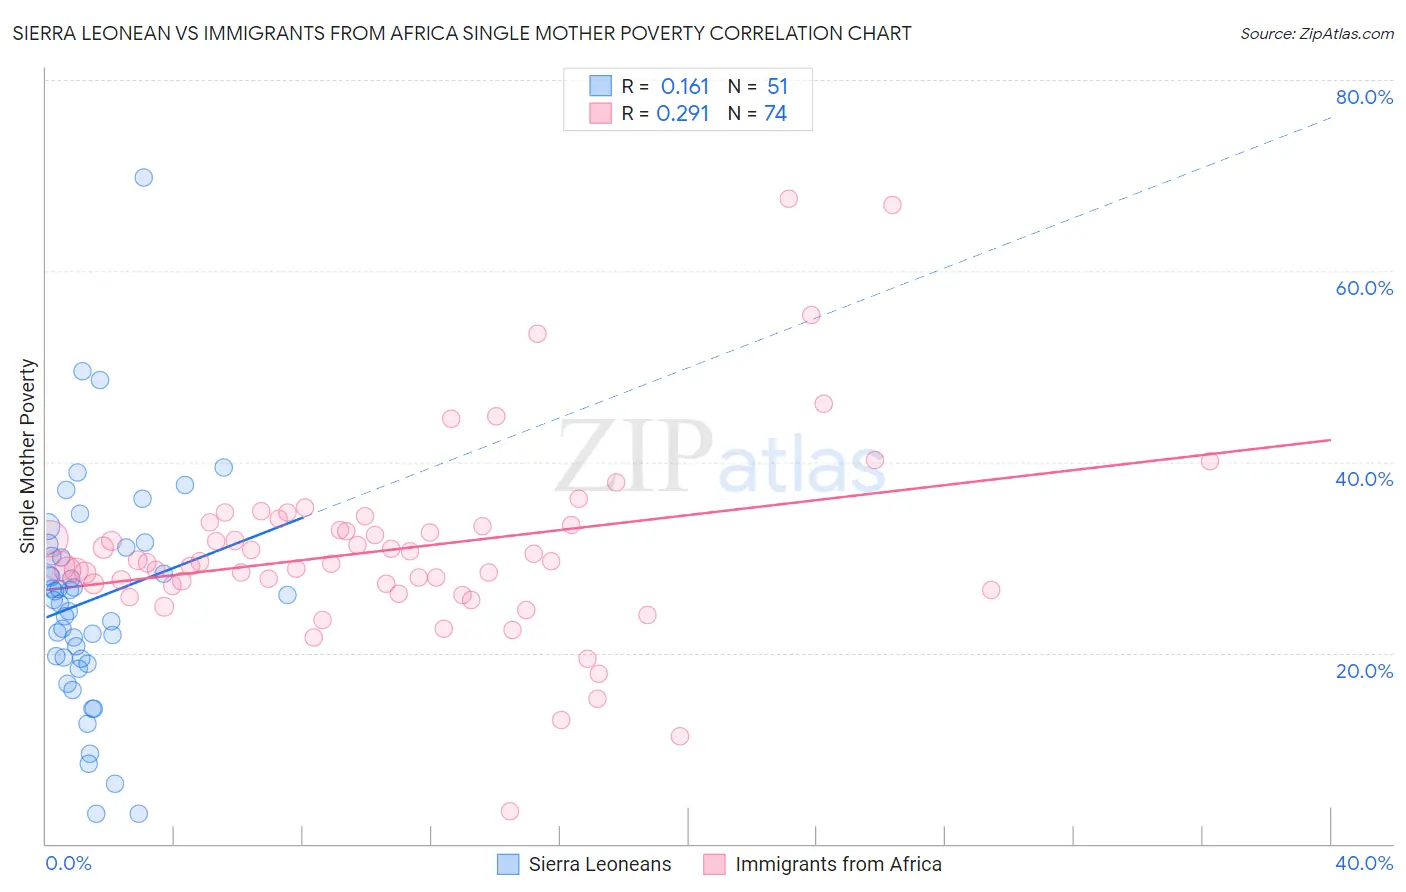
Sierra Leonean vs Immigrants from Africa Single Mother Poverty Correlation Chart

The statistical analysis conducted on geographies consisting of 83,072,166 people shows a poor positive correlation between the proportion of Sierra Leoneans and poverty level among single mothers in the United States with a correlation coefficient (R) of 0.161 and weighted average of 27.4%. Similarly, the statistical analysis conducted on geographies consisting of 456,007,162 people shows a weak positive correlation between the proportion of Immigrants from Africa and poverty level among single mothers in the United States with a correlation coefficient (R) of 0.291 and weighted average of 29.4%, a difference of 7.3%.
Sierra Leonean vs Immigrants from Africa Single Mother Poverty

Single Mother Poverty Correlation Summary

MeasurementSierra LeoneanImmigrants from Africa
Minimum3.1%3.4%
Maximum69.8%67.6%
Range66.7%64.1%
Mean25.5%30.9%
Median25.6%29.5%
Interquartile 25% (IQ1)19.4%27.1%
Interquartile 75% (IQ3)31.0%33.3%
Interquartile Range (IQR)11.6%6.3%
Standard Deviation (Sample)11.8%10.1%
Standard Deviation (Population)11.7%10.0%

Similar Demographics by Single Mother Poverty

Demographics Similar to Sierra Leoneans by Single Mother Poverty

In terms of single mother poverty, the demographic groups most similar to Sierra Leoneans are Immigrants from Russia (27.4%, a difference of 0.060%), Immigrants from Europe (27.4%, a difference of 0.060%), Macedonian (27.4%, a difference of 0.090%), Immigrants from Belarus (27.4%, a difference of 0.11%), and Lithuanian (27.4%, a difference of 0.12%).
DemographicsRating | RankSingle Mother Poverty
Soviet Union
99.5
/100
|
#66
Exceptional
27.3%
Immigrants | Australia
99.5
/100
|
#67
Exceptional
27.3%
Immigrants | Czechoslovakia
99.5
/100
|
#68
Exceptional
27.4%
Lithuanians
99.4
/100
|
#69
Exceptional
27.4%
Immigrants | Belarus
99.4
/100
|
#70
Exceptional
27.4%
Macedonians
99.4
/100
|
#71
Exceptional
27.4%
Immigrants | Russia
99.4
/100
|
#72
Exceptional
27.4%
Sierra Leoneans
99.3
/100
|
#73
Exceptional
27.4%
Immigrants | Europe
99.3
/100
|
#74
Exceptional
27.4%
Immigrants | Sweden
99.2
/100
|
#75
Exceptional
27.5%
Peruvians
99.2
/100
|
#76
Exceptional
27.5%
Immigrants | Peru
99.2
/100
|
#77
Exceptional
27.5%
Immigrants | North Macedonia
99.2
/100
|
#78
Exceptional
27.5%
Immigrants | Italy
99.1
/100
|
#79
Exceptional
27.5%
Taiwanese
99.1
/100
|
#80
Exceptional
27.5%

Demographics Similar to Immigrants from Africa by Single Mother Poverty

In terms of single mother poverty, the demographic groups most similar to Immigrants from Africa are Guamanian/Chamorro (29.4%, a difference of 0.010%), Lebanese (29.4%, a difference of 0.050%), Immigrants from Germany (29.5%, a difference of 0.070%), Immigrants from Trinidad and Tobago (29.5%, a difference of 0.13%), and Moroccan (29.5%, a difference of 0.17%).
DemographicsRating | RankSingle Mother Poverty
Immigrants | Eastern Africa
38.5
/100
|
#182
Fair
29.3%
Nepalese
38.3
/100
|
#183
Fair
29.3%
Nigerians
38.0
/100
|
#184
Fair
29.3%
Ghanaians
36.8
/100
|
#185
Fair
29.4%
Yugoslavians
36.0
/100
|
#186
Fair
29.4%
Lebanese
32.5
/100
|
#187
Fair
29.4%
Guamanians/Chamorros
31.8
/100
|
#188
Fair
29.4%
Immigrants | Africa
31.6
/100
|
#189
Fair
29.4%
Immigrants | Germany
30.4
/100
|
#190
Fair
29.5%
Immigrants | Trinidad and Tobago
29.2
/100
|
#191
Fair
29.5%
Moroccans
28.6
/100
|
#192
Fair
29.5%
Basques
28.3
/100
|
#193
Fair
29.5%
Icelanders
26.1
/100
|
#194
Fair
29.5%
Slavs
24.5
/100
|
#195
Fair
29.6%
Spanish American Indians
23.4
/100
|
#196
Fair
29.6%