Portuguese vs Immigrants from Barbados Single Mother Poverty
COMPARE
Portuguese
Immigrants from Barbados
Single Mother Poverty
Single Mother Poverty Comparison
Portuguese
Immigrants from Barbados
28.8%
SINGLE MOTHER POVERTY
73.2/ 100
METRIC RATING
154th/ 347
METRIC RANK
30.2%
SINGLE MOTHER POVERTY
5.0/ 100
METRIC RATING
229th/ 347
METRIC RANK
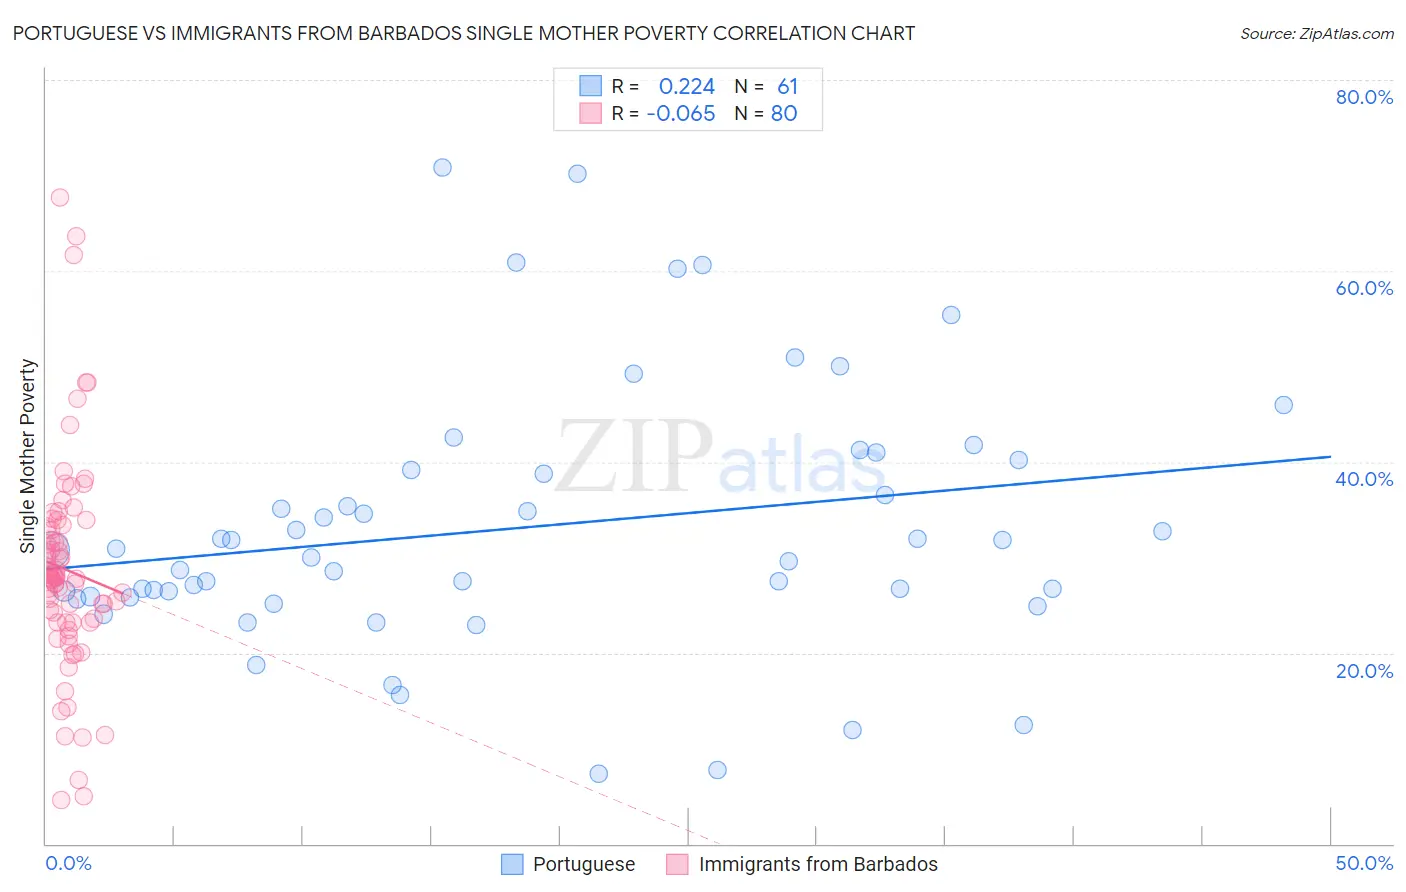
Portuguese vs Immigrants from Barbados Single Mother Poverty Correlation Chart
The statistical analysis conducted on geographies consisting of 435,396,736 people shows a weak positive correlation between the proportion of Portuguese and poverty level among single mothers in the United States with a correlation coefficient (R) of 0.224 and weighted average of 28.8%. Similarly, the statistical analysis conducted on geographies consisting of 111,955,379 people shows a slight negative correlation between the proportion of Immigrants from Barbados and poverty level among single mothers in the United States with a correlation coefficient (R) of -0.065 and weighted average of 30.2%, a difference of 4.8%.
Single Mother Poverty Correlation Summary
| Measurement | Portuguese | Immigrants from Barbados |
| Minimum | 7.4% | 4.6% |
| Maximum | 70.8% | 67.7% |
| Range | 63.4% | 63.0% |
| Mean | 33.1% | 28.7% |
| Median | 30.8% | 27.9% |
| Interquartile 25% (IQ1) | 25.9% | 23.2% |
| Interquartile 75% (IQ3) | 39.7% | 33.2% |
| Interquartile Range (IQR) | 13.8% | 10.0% |
| Standard Deviation (Sample) | 13.6% | 11.2% |
| Standard Deviation (Population) | 13.5% | 11.1% |
Similar Demographics by Single Mother Poverty
Demographics Similar to Portuguese by Single Mother Poverty
In terms of single mother poverty, the demographic groups most similar to Portuguese are Ugandan (28.8%, a difference of 0.090%), Iraqi (28.8%, a difference of 0.10%), Immigrants from Western Europe (28.9%, a difference of 0.13%), Immigrants from Hungary (28.9%, a difference of 0.16%), and Slovene (28.8%, a difference of 0.21%).
| Demographics | Rating | Rank | Single Mother Poverty |
| Immigrants | Lebanon | 85.3 /100 | #147 | Excellent 28.6% |
| Syrians | 85.3 /100 | #148 | Excellent 28.6% |
| Serbians | 85.0 /100 | #149 | Excellent 28.6% |
| Northern Europeans | 81.7 /100 | #150 | Excellent 28.6% |
| Immigrants | Oceania | 79.9 /100 | #151 | Good 28.7% |
| Austrians | 79.0 /100 | #152 | Good 28.7% |
| Slovenes | 76.4 /100 | #153 | Good 28.8% |
| Portuguese | 73.2 /100 | #154 | Good 28.8% |
| Ugandans | 71.7 /100 | #155 | Good 28.8% |
| Iraqis | 71.5 /100 | #156 | Good 28.8% |
| Immigrants | Western Europe | 71.1 /100 | #157 | Good 28.9% |
| Immigrants | Hungary | 70.6 /100 | #158 | Good 28.9% |
| Czechs | 68.4 /100 | #159 | Good 28.9% |
| Japanese | 68.0 /100 | #160 | Good 28.9% |
| Immigrants | Cambodia | 66.6 /100 | #161 | Good 28.9% |
Demographics Similar to Immigrants from Barbados by Single Mother Poverty
In terms of single mother poverty, the demographic groups most similar to Immigrants from Barbados are English (30.2%, a difference of 0.040%), Spaniard (30.2%, a difference of 0.090%), Dutch (30.2%, a difference of 0.19%), Immigrants from Liberia (30.1%, a difference of 0.20%), and Scottish (30.1%, a difference of 0.23%).
| Demographics | Rating | Rank | Single Mother Poverty |
| Sudanese | 7.6 /100 | #222 | Tragic 30.0% |
| Immigrants | Cuba | 6.9 /100 | #223 | Tragic 30.1% |
| Immigrants | Sudan | 6.5 /100 | #224 | Tragic 30.1% |
| Spanish | 6.3 /100 | #225 | Tragic 30.1% |
| Scottish | 6.0 /100 | #226 | Tragic 30.1% |
| Immigrants | Liberia | 5.9 /100 | #227 | Tragic 30.1% |
| Spaniards | 5.4 /100 | #228 | Tragic 30.2% |
| Immigrants | Barbados | 5.0 /100 | #229 | Tragic 30.2% |
| English | 4.8 /100 | #230 | Tragic 30.2% |
| Dutch | 4.3 /100 | #231 | Tragic 30.2% |
| Alaskan Athabascans | 4.1 /100 | #232 | Tragic 30.3% |
| Immigrants | Middle Africa | 3.5 /100 | #233 | Tragic 30.3% |
| Immigrants | Nicaragua | 3.5 /100 | #234 | Tragic 30.3% |
| Immigrants | Grenada | 3.4 /100 | #235 | Tragic 30.3% |
| Welsh | 3.2 /100 | #236 | Tragic 30.4% |