Shoshone vs Immigrants from Vietnam Single Mother Poverty
COMPARE
Shoshone
Immigrants from Vietnam
Single Mother Poverty
Single Mother Poverty Comparison
Shoshone
Immigrants from Vietnam
32.9%
SINGLE MOTHER POVERTY
0.0/ 100
METRIC RATING
292nd/ 347
METRIC RANK
26.7%
SINGLE MOTHER POVERTY
99.9/ 100
METRIC RATING
40th/ 347
METRIC RANK
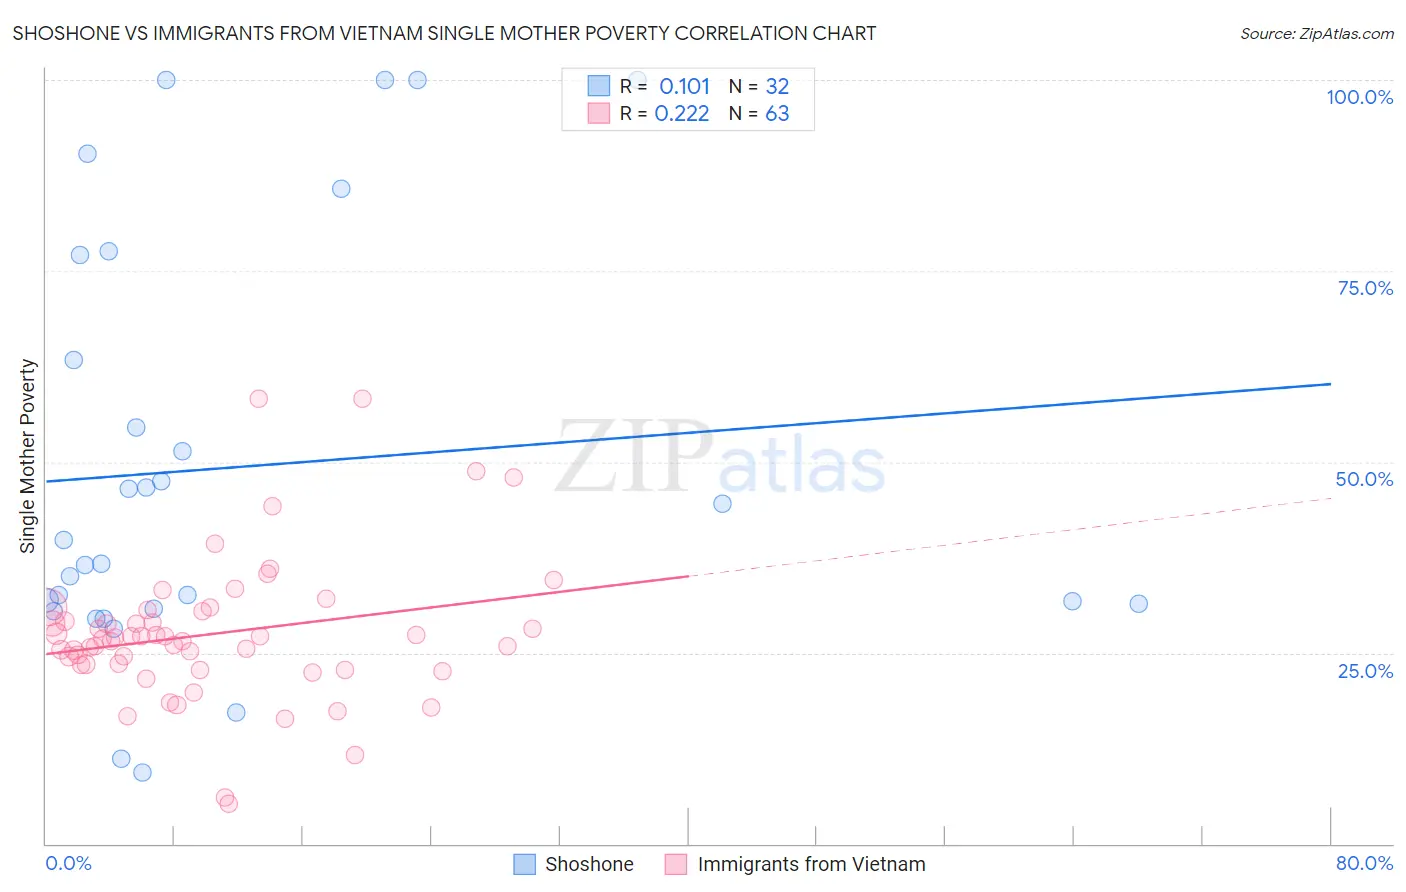
Shoshone vs Immigrants from Vietnam Single Mother Poverty Correlation Chart
The statistical analysis conducted on geographies consisting of 66,288,381 people shows a poor positive correlation between the proportion of Shoshone and poverty level among single mothers in the United States with a correlation coefficient (R) of 0.101 and weighted average of 32.9%. Similarly, the statistical analysis conducted on geographies consisting of 395,889,190 people shows a weak positive correlation between the proportion of Immigrants from Vietnam and poverty level among single mothers in the United States with a correlation coefficient (R) of 0.222 and weighted average of 26.7%, a difference of 23.2%.
Single Mother Poverty Correlation Summary
| Measurement | Shoshone | Immigrants from Vietnam |
| Minimum | 9.3% | 5.2% |
| Maximum | 100.0% | 58.3% |
| Range | 90.7% | 53.1% |
| Mean | 49.3% | 27.5% |
| Median | 38.2% | 26.8% |
| Interquartile 25% (IQ1) | 31.1% | 23.5% |
| Interquartile 75% (IQ3) | 70.2% | 30.5% |
| Interquartile Range (IQR) | 39.1% | 7.0% |
| Standard Deviation (Sample) | 27.4% | 9.5% |
| Standard Deviation (Population) | 27.0% | 9.4% |
Similar Demographics by Single Mother Poverty
Demographics Similar to Shoshone by Single Mother Poverty
In terms of single mother poverty, the demographic groups most similar to Shoshone are Guatemalan (32.9%, a difference of 0.020%), Aleut (32.9%, a difference of 0.030%), French American Indian (33.1%, a difference of 0.66%), Yaqui (33.1%, a difference of 0.69%), and Blackfeet (33.2%, a difference of 0.85%).
| Demographics | Rating | Rank | Single Mother Poverty |
| Immigrants | Latin America | 0.0 /100 | #285 | Tragic 32.4% |
| Yup'ik | 0.0 /100 | #286 | Tragic 32.5% |
| Immigrants | Dominica | 0.0 /100 | #287 | Tragic 32.5% |
| Somalis | 0.0 /100 | #288 | Tragic 32.6% |
| U.S. Virgin Islanders | 0.0 /100 | #289 | Tragic 32.6% |
| Osage | 0.0 /100 | #290 | Tragic 32.6% |
| Guatemalans | 0.0 /100 | #291 | Tragic 32.9% |
| Shoshone | 0.0 /100 | #292 | Tragic 32.9% |
| Aleuts | 0.0 /100 | #293 | Tragic 32.9% |
| French American Indians | 0.0 /100 | #294 | Tragic 33.1% |
| Yaqui | 0.0 /100 | #295 | Tragic 33.1% |
| Blackfeet | 0.0 /100 | #296 | Tragic 33.2% |
| Pennsylvania Germans | 0.0 /100 | #297 | Tragic 33.2% |
| Africans | 0.0 /100 | #298 | Tragic 33.3% |
| Immigrants | Guatemala | 0.0 /100 | #299 | Tragic 33.3% |
Demographics Similar to Immigrants from Vietnam by Single Mother Poverty
In terms of single mother poverty, the demographic groups most similar to Immigrants from Vietnam are Immigrants from Greece (26.7%, a difference of 0.070%), Sri Lankan (26.7%, a difference of 0.090%), Armenian (26.8%, a difference of 0.31%), Tsimshian (26.8%, a difference of 0.39%), and Immigrants from Fiji (26.6%, a difference of 0.43%).
| Demographics | Rating | Rank | Single Mother Poverty |
| Bulgarians | 99.9 /100 | #33 | Exceptional 26.5% |
| Immigrants | Indonesia | 99.9 /100 | #34 | Exceptional 26.6% |
| Maltese | 99.9 /100 | #35 | Exceptional 26.6% |
| Okinawans | 99.9 /100 | #36 | Exceptional 26.6% |
| Immigrants | Israel | 99.9 /100 | #37 | Exceptional 26.6% |
| Immigrants | Fiji | 99.9 /100 | #38 | Exceptional 26.6% |
| Sri Lankans | 99.9 /100 | #39 | Exceptional 26.7% |
| Immigrants | Vietnam | 99.9 /100 | #40 | Exceptional 26.7% |
| Immigrants | Greece | 99.9 /100 | #41 | Exceptional 26.7% |
| Armenians | 99.9 /100 | #42 | Exceptional 26.8% |
| Tsimshian | 99.9 /100 | #43 | Exceptional 26.8% |
| Immigrants | Sierra Leone | 99.9 /100 | #44 | Exceptional 26.9% |
| Latvians | 99.9 /100 | #45 | Exceptional 26.9% |
| Immigrants | Serbia | 99.9 /100 | #46 | Exceptional 26.9% |
| Egyptians | 99.8 /100 | #47 | Exceptional 26.9% |