Shoshone vs Serbian Single Mother Poverty
COMPARE
Shoshone
Serbian
Single Mother Poverty
Single Mother Poverty Comparison
Shoshone
Serbians
32.9%
SINGLE MOTHER POVERTY
0.0/ 100
METRIC RATING
292nd/ 347
METRIC RANK
28.6%
SINGLE MOTHER POVERTY
85.0/ 100
METRIC RATING
149th/ 347
METRIC RANK
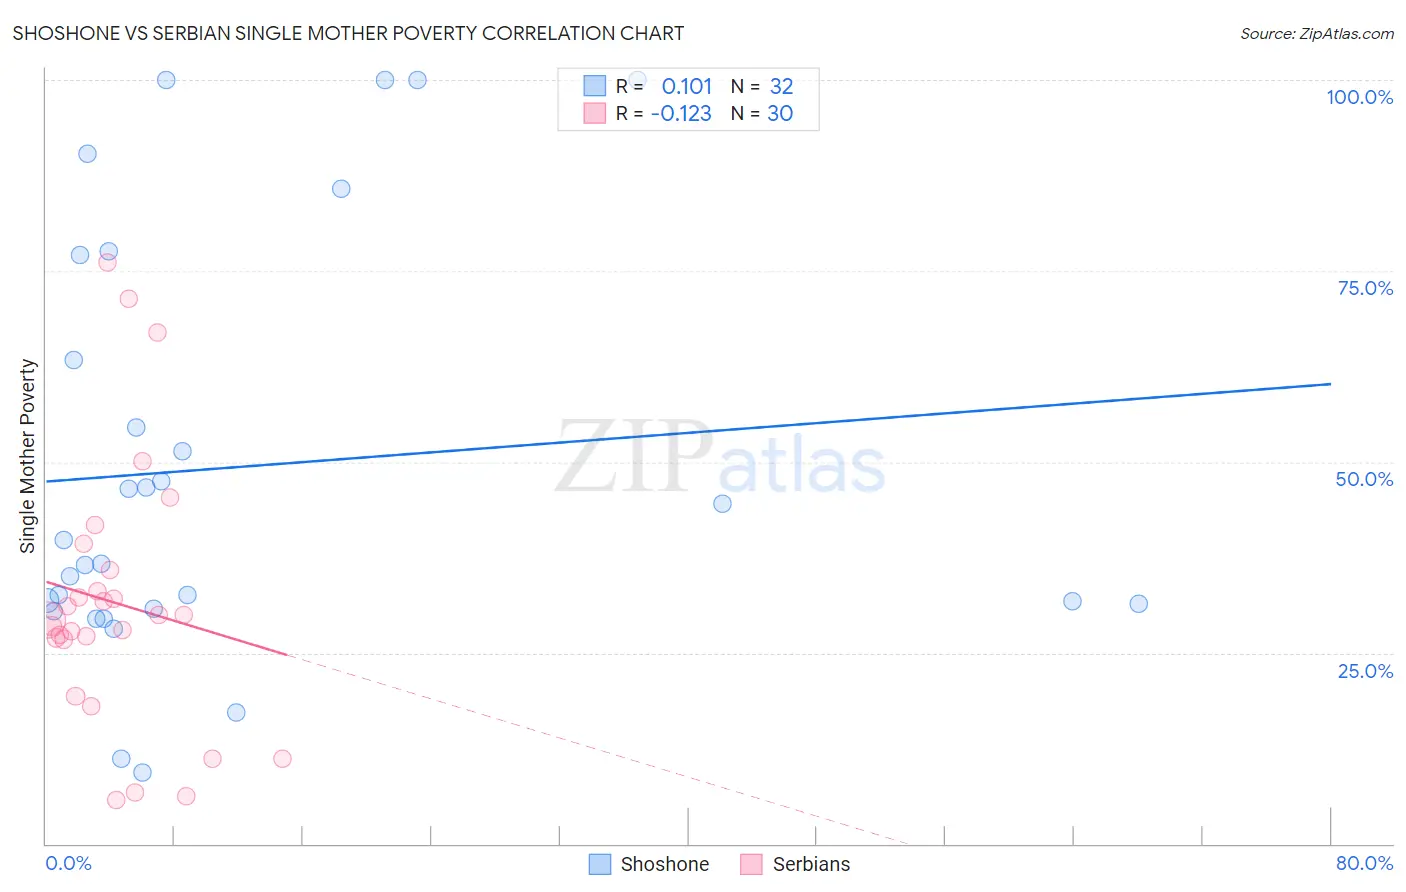
Shoshone vs Serbian Single Mother Poverty Correlation Chart
The statistical analysis conducted on geographies consisting of 66,288,381 people shows a poor positive correlation between the proportion of Shoshone and poverty level among single mothers in the United States with a correlation coefficient (R) of 0.101 and weighted average of 32.9%. Similarly, the statistical analysis conducted on geographies consisting of 262,198,183 people shows a poor negative correlation between the proportion of Serbians and poverty level among single mothers in the United States with a correlation coefficient (R) of -0.123 and weighted average of 28.6%, a difference of 15.2%.
Single Mother Poverty Correlation Summary
| Measurement | Shoshone | Serbian |
| Minimum | 9.3% | 5.8% |
| Maximum | 100.0% | 76.1% |
| Range | 90.7% | 70.4% |
| Mean | 49.3% | 31.6% |
| Median | 38.2% | 29.6% |
| Interquartile 25% (IQ1) | 31.1% | 26.8% |
| Interquartile 75% (IQ3) | 70.2% | 35.8% |
| Interquartile Range (IQR) | 39.1% | 9.0% |
| Standard Deviation (Sample) | 27.4% | 17.4% |
| Standard Deviation (Population) | 27.0% | 17.1% |
Similar Demographics by Single Mother Poverty
Demographics Similar to Shoshone by Single Mother Poverty
In terms of single mother poverty, the demographic groups most similar to Shoshone are Guatemalan (32.9%, a difference of 0.020%), Aleut (32.9%, a difference of 0.030%), French American Indian (33.1%, a difference of 0.66%), Yaqui (33.1%, a difference of 0.69%), and Blackfeet (33.2%, a difference of 0.85%).
| Demographics | Rating | Rank | Single Mother Poverty |
| Immigrants | Latin America | 0.0 /100 | #285 | Tragic 32.4% |
| Yup'ik | 0.0 /100 | #286 | Tragic 32.5% |
| Immigrants | Dominica | 0.0 /100 | #287 | Tragic 32.5% |
| Somalis | 0.0 /100 | #288 | Tragic 32.6% |
| U.S. Virgin Islanders | 0.0 /100 | #289 | Tragic 32.6% |
| Osage | 0.0 /100 | #290 | Tragic 32.6% |
| Guatemalans | 0.0 /100 | #291 | Tragic 32.9% |
| Shoshone | 0.0 /100 | #292 | Tragic 32.9% |
| Aleuts | 0.0 /100 | #293 | Tragic 32.9% |
| French American Indians | 0.0 /100 | #294 | Tragic 33.1% |
| Yaqui | 0.0 /100 | #295 | Tragic 33.1% |
| Blackfeet | 0.0 /100 | #296 | Tragic 33.2% |
| Pennsylvania Germans | 0.0 /100 | #297 | Tragic 33.2% |
| Africans | 0.0 /100 | #298 | Tragic 33.3% |
| Immigrants | Guatemala | 0.0 /100 | #299 | Tragic 33.3% |
Demographics Similar to Serbians by Single Mother Poverty
In terms of single mother poverty, the demographic groups most similar to Serbians are Syrian (28.6%, a difference of 0.020%), Immigrants from Lebanon (28.6%, a difference of 0.030%), Immigrants from Denmark (28.5%, a difference of 0.10%), Immigrants from South America (28.5%, a difference of 0.11%), and Luxembourger (28.5%, a difference of 0.14%).
| Demographics | Rating | Rank | Single Mother Poverty |
| South Africans | 86.6 /100 | #142 | Excellent 28.5% |
| Immigrants | North America | 86.5 /100 | #143 | Excellent 28.5% |
| Luxembourgers | 86.4 /100 | #144 | Excellent 28.5% |
| Immigrants | South America | 86.1 /100 | #145 | Excellent 28.5% |
| Immigrants | Denmark | 86.1 /100 | #146 | Excellent 28.5% |
| Immigrants | Lebanon | 85.3 /100 | #147 | Excellent 28.6% |
| Syrians | 85.3 /100 | #148 | Excellent 28.6% |
| Serbians | 85.0 /100 | #149 | Excellent 28.6% |
| Northern Europeans | 81.7 /100 | #150 | Excellent 28.6% |
| Immigrants | Oceania | 79.9 /100 | #151 | Good 28.7% |
| Austrians | 79.0 /100 | #152 | Good 28.7% |
| Slovenes | 76.4 /100 | #153 | Good 28.8% |
| Portuguese | 73.2 /100 | #154 | Good 28.8% |
| Ugandans | 71.7 /100 | #155 | Good 28.8% |
| Iraqis | 71.5 /100 | #156 | Good 28.8% |