Costa Rican vs Immigrants from South Eastern Asia Child Poverty Among Girls Under 16
COMPARE
Costa Rican
Immigrants from South Eastern Asia
Child Poverty Among Girls Under 16
Child Poverty Among Girls Under 16 Comparison
Costa Ricans
Immigrants from South Eastern Asia
16.2%
CHILD POVERTY AMONG GIRLS UNDER 16
64.2/ 100
METRIC RATING
169th/ 347
METRIC RANK
15.4%
CHILD POVERTY AMONG GIRLS UNDER 16
90.5/ 100
METRIC RATING
129th/ 347
METRIC RANK
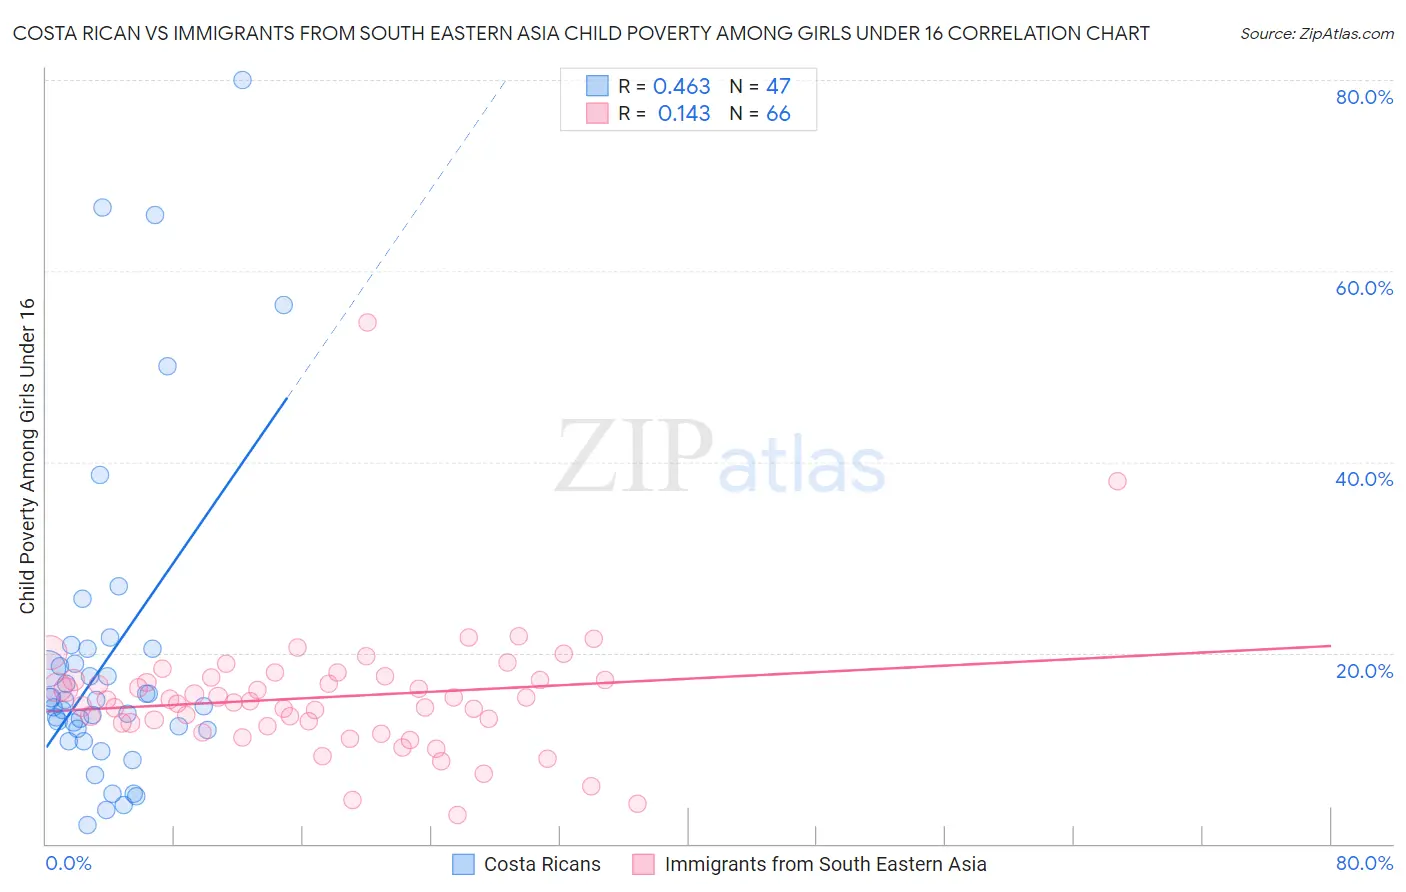
Costa Rican vs Immigrants from South Eastern Asia Child Poverty Among Girls Under 16 Correlation Chart
The statistical analysis conducted on geographies consisting of 251,202,107 people shows a moderate positive correlation between the proportion of Costa Ricans and poverty level among girls under the age of 16 in the United States with a correlation coefficient (R) of 0.463 and weighted average of 16.2%. Similarly, the statistical analysis conducted on geographies consisting of 498,768,051 people shows a poor positive correlation between the proportion of Immigrants from South Eastern Asia and poverty level among girls under the age of 16 in the United States with a correlation coefficient (R) of 0.143 and weighted average of 15.4%, a difference of 5.1%.
Child Poverty Among Girls Under 16 Correlation Summary
| Measurement | Costa Rican | Immigrants from South Eastern Asia |
| Minimum | 2.0% | 3.0% |
| Maximum | 80.0% | 54.5% |
| Range | 78.0% | 51.5% |
| Mean | 19.6% | 15.4% |
| Median | 15.0% | 15.0% |
| Interquartile 25% (IQ1) | 11.9% | 12.7% |
| Interquartile 75% (IQ3) | 20.4% | 17.1% |
| Interquartile Range (IQR) | 8.5% | 4.4% |
| Standard Deviation (Sample) | 17.0% | 7.0% |
| Standard Deviation (Population) | 16.8% | 7.0% |
Similar Demographics by Child Poverty Among Girls Under 16
Demographics Similar to Costa Ricans by Child Poverty Among Girls Under 16
In terms of child poverty among girls under 16, the demographic groups most similar to Costa Ricans are Immigrants from Venezuela (16.2%, a difference of 0.0%), Yugoslavian (16.2%, a difference of 0.010%), Immigrants from Saudi Arabia (16.2%, a difference of 0.030%), Uruguayan (16.2%, a difference of 0.060%), and Afghan (16.2%, a difference of 0.24%).
| Demographics | Rating | Rank | Child Poverty Among Girls Under 16 |
| French Canadians | 68.7 /100 | #162 | Good 16.1% |
| Immigrants | Oceania | 68.4 /100 | #163 | Good 16.1% |
| Immigrants | Colombia | 67.8 /100 | #164 | Good 16.1% |
| Immigrants | Germany | 67.3 /100 | #165 | Good 16.1% |
| South Americans | 67.2 /100 | #166 | Good 16.1% |
| Uruguayans | 64.7 /100 | #167 | Good 16.2% |
| Yugoslavians | 64.4 /100 | #168 | Good 16.2% |
| Costa Ricans | 64.2 /100 | #169 | Good 16.2% |
| Immigrants | Venezuela | 64.2 /100 | #170 | Good 16.2% |
| Immigrants | Saudi Arabia | 64.0 /100 | #171 | Good 16.2% |
| Afghans | 62.3 /100 | #172 | Good 16.2% |
| Immigrants | South America | 55.1 /100 | #173 | Average 16.4% |
| Ethiopians | 50.0 /100 | #174 | Average 16.5% |
| Lebanese | 45.4 /100 | #175 | Average 16.6% |
| Hungarians | 45.1 /100 | #176 | Average 16.6% |
Demographics Similar to Immigrants from South Eastern Asia by Child Poverty Among Girls Under 16
In terms of child poverty among girls under 16, the demographic groups most similar to Immigrants from South Eastern Asia are Albanian (15.4%, a difference of 0.010%), Immigrants from Norway (15.4%, a difference of 0.10%), Puget Sound Salish (15.4%, a difference of 0.16%), Scottish (15.4%, a difference of 0.17%), and Immigrants from Western Europe (15.4%, a difference of 0.18%).
| Demographics | Rating | Rank | Child Poverty Among Girls Under 16 |
| Portuguese | 91.8 /100 | #122 | Exceptional 15.3% |
| Irish | 91.5 /100 | #123 | Exceptional 15.3% |
| Carpatho Rusyns | 91.4 /100 | #124 | Exceptional 15.3% |
| Peruvians | 91.2 /100 | #125 | Exceptional 15.4% |
| Scottish | 91.0 /100 | #126 | Exceptional 15.4% |
| Immigrants | Norway | 90.8 /100 | #127 | Exceptional 15.4% |
| Albanians | 90.5 /100 | #128 | Exceptional 15.4% |
| Immigrants | South Eastern Asia | 90.5 /100 | #129 | Exceptional 15.4% |
| Puget Sound Salish | 90.1 /100 | #130 | Exceptional 15.4% |
| Immigrants | Western Europe | 90.0 /100 | #131 | Exceptional 15.4% |
| Mongolians | 89.7 /100 | #132 | Excellent 15.4% |
| Brazilians | 89.6 /100 | #133 | Excellent 15.4% |
| Immigrants | Spain | 89.1 /100 | #134 | Excellent 15.5% |
| Czechoslovakians | 89.0 /100 | #135 | Excellent 15.5% |
| Native Hawaiians | 89.0 /100 | #136 | Excellent 15.5% |