Senegalese vs Scotch-Irish College, 1 year or more
COMPARE
Senegalese
Scotch-Irish
College, 1 year or more
College, 1 year or more Comparison
Senegalese
Scotch-Irish
58.2%
COLLEGE, 1 YEAR OR MORE
16.9/ 100
METRIC RATING
207th/ 347
METRIC RANK
58.9%
COLLEGE, 1 YEAR OR MORE
34.7/ 100
METRIC RATING
186th/ 347
METRIC RANK
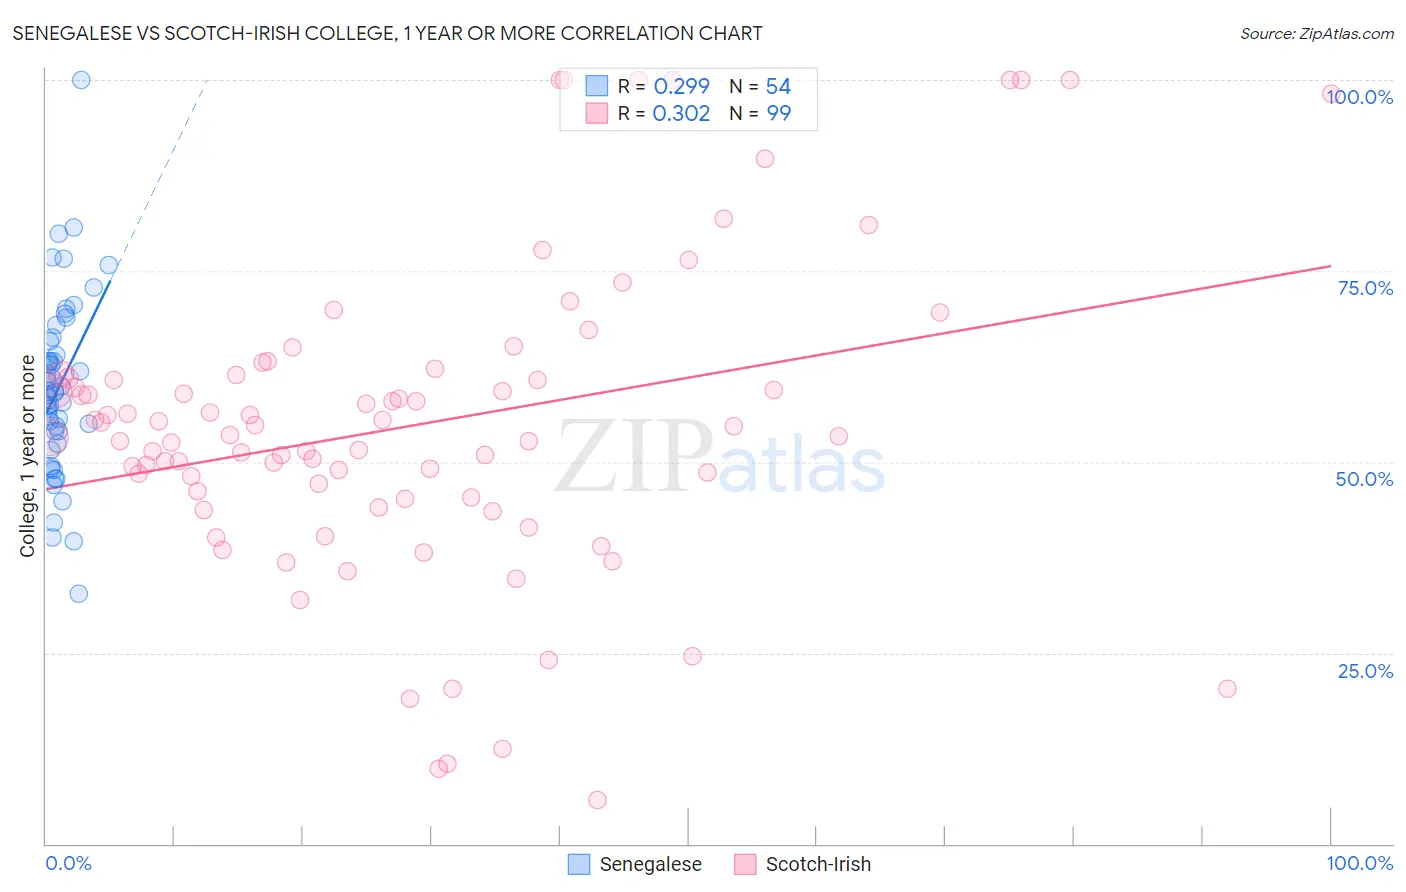
Senegalese vs Scotch-Irish College, 1 year or more Correlation Chart
The statistical analysis conducted on geographies consisting of 78,142,569 people shows a weak positive correlation between the proportion of Senegalese and percentage of population with at least college, 1 year or more education in the United States with a correlation coefficient (R) of 0.299 and weighted average of 58.2%. Similarly, the statistical analysis conducted on geographies consisting of 548,772,919 people shows a mild positive correlation between the proportion of Scotch-Irish and percentage of population with at least college, 1 year or more education in the United States with a correlation coefficient (R) of 0.302 and weighted average of 58.9%, a difference of 1.3%.
College, 1 year or more Correlation Summary
| Measurement | Senegalese | Scotch-Irish |
| Minimum | 32.7% | 5.7% |
| Maximum | 100.0% | 100.0% |
| Range | 67.3% | 94.3% |
| Mean | 59.8% | 54.8% |
| Median | 59.2% | 53.5% |
| Interquartile 25% (IQ1) | 54.0% | 45.3% |
| Interquartile 75% (IQ3) | 65.8% | 61.3% |
| Interquartile Range (IQR) | 11.8% | 16.0% |
| Standard Deviation (Sample) | 11.7% | 20.2% |
| Standard Deviation (Population) | 11.6% | 20.1% |
Similar Demographics by College, 1 year or more
Demographics Similar to Senegalese by College, 1 year or more
In terms of college, 1 year or more, the demographic groups most similar to Senegalese are Immigrants from Vietnam (58.2%, a difference of 0.12%), Immigrants from Zaire (58.3%, a difference of 0.16%), Immigrants from Uruguay (58.1%, a difference of 0.17%), Panamanian (58.3%, a difference of 0.21%), and Immigrants from Middle Africa (58.0%, a difference of 0.30%).
| Demographics | Rating | Rank | College, 1 year or more |
| Spanish | 24.2 /100 | #200 | Fair 58.5% |
| Nigerians | 23.0 /100 | #201 | Fair 58.5% |
| Immigrants | South America | 21.9 /100 | #202 | Fair 58.4% |
| Ghanaians | 20.9 /100 | #203 | Fair 58.4% |
| Panamanians | 19.2 /100 | #204 | Poor 58.3% |
| Immigrants | Zaire | 18.7 /100 | #205 | Poor 58.3% |
| Immigrants | Vietnam | 18.2 /100 | #206 | Poor 58.2% |
| Senegalese | 16.9 /100 | #207 | Poor 58.2% |
| Immigrants | Uruguay | 15.2 /100 | #208 | Poor 58.1% |
| Immigrants | Middle Africa | 14.0 /100 | #209 | Poor 58.0% |
| Tsimshian | 13.5 /100 | #210 | Poor 57.9% |
| Immigrants | Nigeria | 13.3 /100 | #211 | Poor 57.9% |
| Immigrants | Senegal | 11.8 /100 | #212 | Poor 57.8% |
| French Canadians | 11.8 /100 | #213 | Poor 57.8% |
| Immigrants | Colombia | 11.6 /100 | #214 | Poor 57.8% |
Demographics Similar to Scotch-Irish by College, 1 year or more
In terms of college, 1 year or more, the demographic groups most similar to Scotch-Irish are German (58.9%, a difference of 0.0%), French (58.9%, a difference of 0.020%), South American (59.0%, a difference of 0.070%), Uruguayan (58.8%, a difference of 0.18%), and Spaniard (59.0%, a difference of 0.21%).
| Demographics | Rating | Rank | College, 1 year or more |
| Bermudans | 46.6 /100 | #179 | Average 59.3% |
| Yugoslavians | 44.1 /100 | #180 | Average 59.2% |
| Swiss | 43.4 /100 | #181 | Average 59.2% |
| Immigrants | Bosnia and Herzegovina | 42.8 /100 | #182 | Average 59.2% |
| German Russians | 39.3 /100 | #183 | Fair 59.1% |
| Spaniards | 38.3 /100 | #184 | Fair 59.0% |
| South Americans | 35.9 /100 | #185 | Fair 59.0% |
| Scotch-Irish | 34.7 /100 | #186 | Fair 58.9% |
| Germans | 34.7 /100 | #187 | Fair 58.9% |
| French | 34.4 /100 | #188 | Fair 58.9% |
| Uruguayans | 31.8 /100 | #189 | Fair 58.8% |
| Immigrants | Cameroon | 31.2 /100 | #190 | Fair 58.8% |
| Immigrants | Philippines | 29.2 /100 | #191 | Fair 58.7% |
| Colombians | 27.6 /100 | #192 | Fair 58.7% |
| Peruvians | 27.5 /100 | #193 | Fair 58.6% |