Immigrants from Guyana vs Inupiat Single Mother Poverty
COMPARE
Immigrants from Guyana
Inupiat
Single Mother Poverty
Single Mother Poverty Comparison
Immigrants from Guyana
Inupiat
29.8%
SINGLE MOTHER POVERTY
14.7/ 100
METRIC RATING
208th/ 347
METRIC RANK
29.0%
SINGLE MOTHER POVERTY
60.4/ 100
METRIC RATING
166th/ 347
METRIC RANK
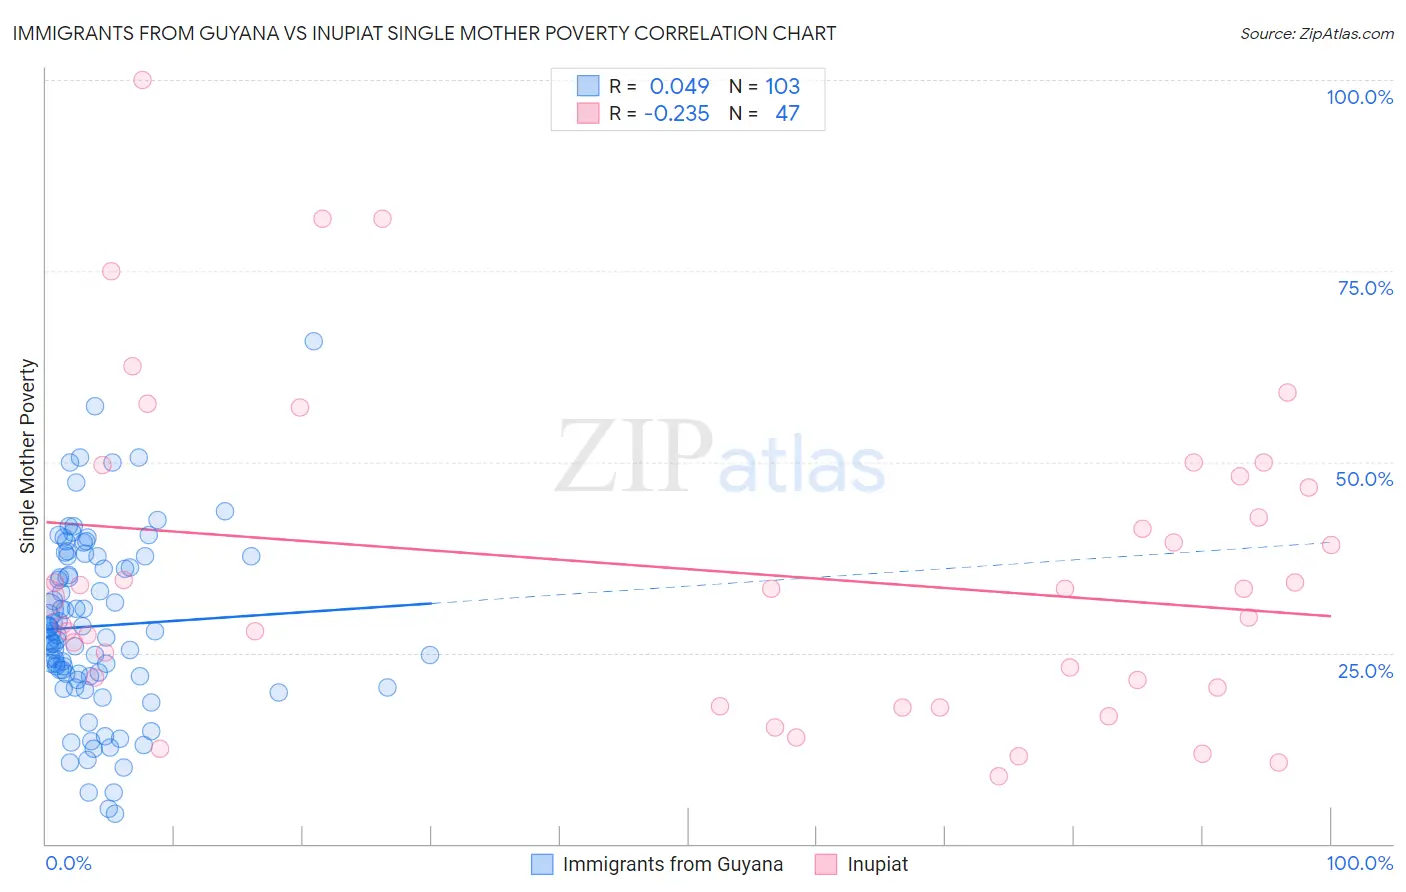
Immigrants from Guyana vs Inupiat Single Mother Poverty Correlation Chart
The statistical analysis conducted on geographies consisting of 180,945,817 people shows no correlation between the proportion of Immigrants from Guyana and poverty level among single mothers in the United States with a correlation coefficient (R) of 0.049 and weighted average of 29.8%. Similarly, the statistical analysis conducted on geographies consisting of 95,875,547 people shows a weak negative correlation between the proportion of Inupiat and poverty level among single mothers in the United States with a correlation coefficient (R) of -0.235 and weighted average of 29.0%, a difference of 2.6%.
Single Mother Poverty Correlation Summary
| Measurement | Immigrants from Guyana | Inupiat |
| Minimum | 4.0% | 8.8% |
| Maximum | 65.7% | 100.0% |
| Range | 61.7% | 91.2% |
| Mean | 28.5% | 35.8% |
| Median | 27.3% | 33.3% |
| Interquartile 25% (IQ1) | 21.9% | 20.5% |
| Interquartile 75% (IQ3) | 37.6% | 48.1% |
| Interquartile Range (IQR) | 15.6% | 27.6% |
| Standard Deviation (Sample) | 11.5% | 20.7% |
| Standard Deviation (Population) | 11.5% | 20.5% |
Similar Demographics by Single Mother Poverty
Demographics Similar to Immigrants from Guyana by Single Mother Poverty
In terms of single mother poverty, the demographic groups most similar to Immigrants from Guyana are Immigrants from Panama (29.8%, a difference of 0.070%), Irish (29.8%, a difference of 0.080%), Immigrants from Haiti (29.7%, a difference of 0.10%), Czechoslovakian (29.7%, a difference of 0.12%), and Haitian (29.8%, a difference of 0.14%).
| Demographics | Rating | Rank | Single Mother Poverty |
| Belgians | 18.8 /100 | #201 | Poor 29.7% |
| Malaysians | 17.4 /100 | #202 | Poor 29.7% |
| Swiss | 17.2 /100 | #203 | Poor 29.7% |
| Immigrants | Immigrants | 16.6 /100 | #204 | Poor 29.7% |
| Czechoslovakians | 16.1 /100 | #205 | Poor 29.7% |
| Immigrants | Haiti | 15.8 /100 | #206 | Poor 29.7% |
| Immigrants | Panama | 15.5 /100 | #207 | Poor 29.8% |
| Immigrants | Guyana | 14.7 /100 | #208 | Poor 29.8% |
| Irish | 13.9 /100 | #209 | Poor 29.8% |
| Haitians | 13.3 /100 | #210 | Poor 29.8% |
| Guyanese | 12.8 /100 | #211 | Poor 29.8% |
| Nicaraguans | 12.4 /100 | #212 | Poor 29.8% |
| Immigrants | Thailand | 12.0 /100 | #213 | Poor 29.9% |
| Liberians | 11.7 /100 | #214 | Poor 29.9% |
| Jamaicans | 11.7 /100 | #215 | Poor 29.9% |
Demographics Similar to Inupiat by Single Mother Poverty
In terms of single mother poverty, the demographic groups most similar to Inupiat are Arab (29.0%, a difference of 0.020%), Costa Rican (29.0%, a difference of 0.10%), European (29.1%, a difference of 0.14%), Immigrants from Uruguay (29.1%, a difference of 0.16%), and New Zealander (29.1%, a difference of 0.26%).
| Demographics | Rating | Rank | Single Mother Poverty |
| Czechs | 68.4 /100 | #159 | Good 28.9% |
| Japanese | 68.0 /100 | #160 | Good 28.9% |
| Immigrants | Cambodia | 66.6 /100 | #161 | Good 28.9% |
| Scandinavians | 66.2 /100 | #162 | Good 28.9% |
| Immigrants | Nigeria | 65.9 /100 | #163 | Good 28.9% |
| Immigrants | Kenya | 65.9 /100 | #164 | Good 28.9% |
| Arabs | 60.7 /100 | #165 | Good 29.0% |
| Inupiat | 60.4 /100 | #166 | Good 29.0% |
| Costa Ricans | 58.4 /100 | #167 | Average 29.0% |
| Europeans | 57.6 /100 | #168 | Average 29.1% |
| Immigrants | Uruguay | 57.2 /100 | #169 | Average 29.1% |
| New Zealanders | 55.1 /100 | #170 | Average 29.1% |
| Puget Sound Salish | 55.1 /100 | #171 | Average 29.1% |
| Carpatho Rusyns | 53.8 /100 | #172 | Average 29.1% |
| British | 50.6 /100 | #173 | Average 29.2% |