Senegalese vs Immigrants from Bangladesh Receiving Food Stamps
COMPARE
Senegalese
Immigrants from Bangladesh
Receiving Food Stamps
Receiving Food Stamps Comparison
Senegalese
Immigrants from Bangladesh
15.4%
RECEIVING FOOD STAMPS
0.0/ 100
METRIC RATING
290th/ 347
METRIC RANK
15.9%
RECEIVING FOOD STAMPS
0.0/ 100
METRIC RATING
300th/ 347
METRIC RANK
Senegalese vs Immigrants from Bangladesh Receiving Food Stamps Correlation Chart
The statistical analysis conducted on geographies consisting of 78,101,043 people shows a mild negative correlation between the proportion of Senegalese and percentage of population receiving government assistance and/or food stamps in the United States with a correlation coefficient (R) of -0.334 and weighted average of 15.4%. Similarly, the statistical analysis conducted on geographies consisting of 203,302,567 people shows a mild positive correlation between the proportion of Immigrants from Bangladesh and percentage of population receiving government assistance and/or food stamps in the United States with a correlation coefficient (R) of 0.393 and weighted average of 15.9%, a difference of 3.4%.
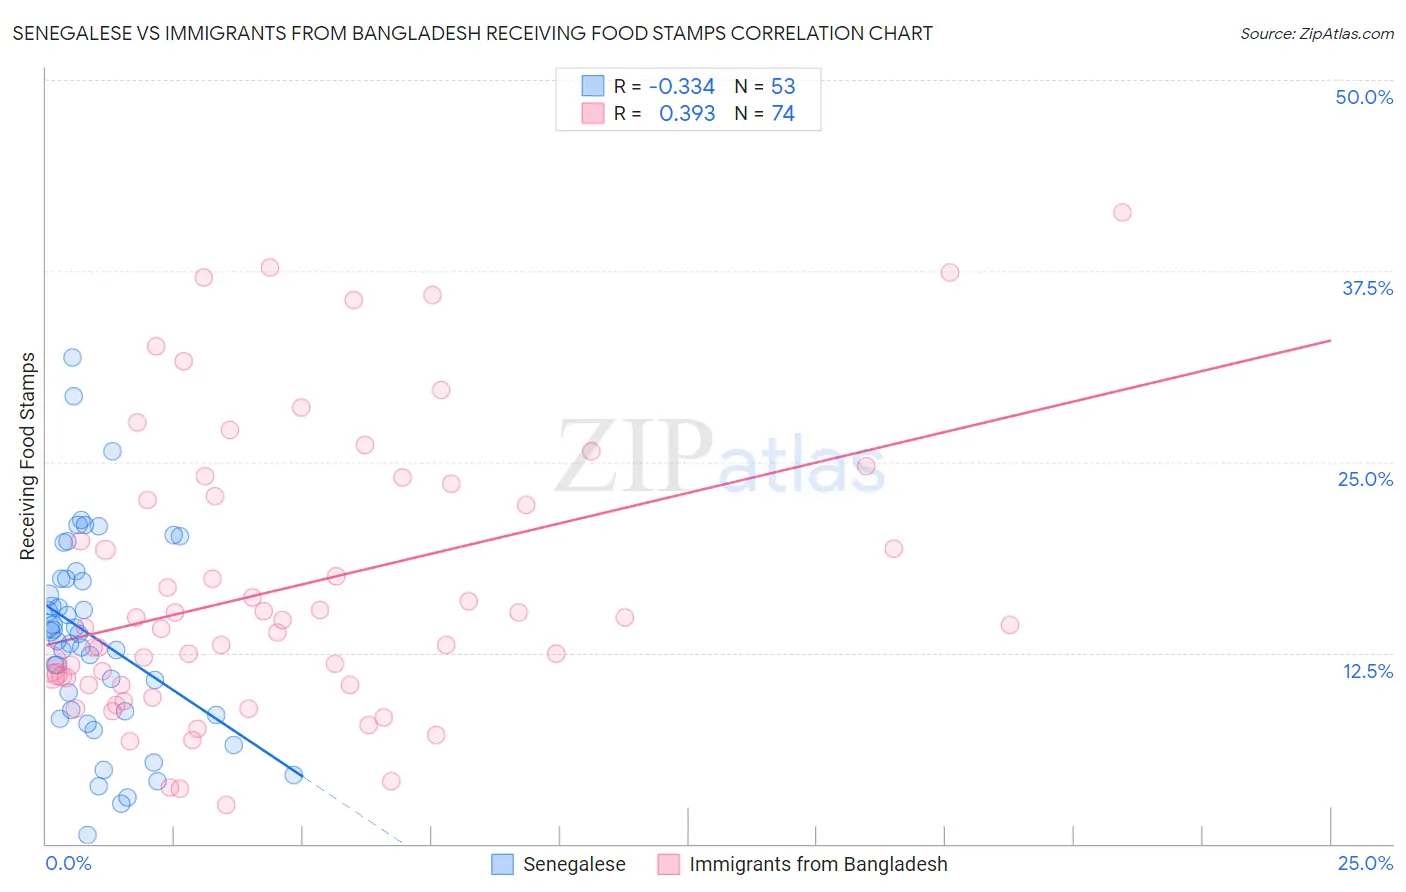
Receiving Food Stamps Correlation Summary
| Measurement | Senegalese | Immigrants from Bangladesh |
| Minimum | 0.60% | 2.5% |
| Maximum | 31.8% | 41.3% |
| Range | 31.2% | 38.8% |
| Mean | 13.5% | 16.8% |
| Median | 13.7% | 14.2% |
| Interquartile 25% (IQ1) | 8.6% | 10.4% |
| Interquartile 75% (IQ3) | 17.4% | 22.7% |
| Interquartile Range (IQR) | 8.8% | 12.3% |
| Standard Deviation (Sample) | 6.6% | 9.2% |
| Standard Deviation (Population) | 6.5% | 9.2% |
Demographics Similar to Senegalese and Immigrants from Bangladesh by Receiving Food Stamps
In terms of receiving food stamps, the demographic groups most similar to Senegalese are Immigrants from Senegal (15.3%, a difference of 0.27%), Honduran (15.5%, a difference of 1.0%), Immigrants from Belize (15.2%, a difference of 1.0%), Alaska Native (15.6%, a difference of 1.5%), and Immigrants from Mexico (15.2%, a difference of 1.5%). Similarly, the demographic groups most similar to Immigrants from Bangladesh are Hispanic or Latino (15.8%, a difference of 0.43%), Trinidadian and Tobagonian (16.0%, a difference of 0.45%), Immigrants from Trinidad and Tobago (15.8%, a difference of 0.71%), Immigrants from Bahamas (15.8%, a difference of 0.96%), and Tsimshian (15.7%, a difference of 1.1%).
| Demographics | Rating | Rank | Receiving Food Stamps |
| Immigrants | Liberia | 0.0 /100 | #285 | Tragic 15.1% |
| Africans | 0.0 /100 | #286 | Tragic 15.1% |
| Immigrants | Mexico | 0.0 /100 | #287 | Tragic 15.2% |
| Immigrants | Belize | 0.0 /100 | #288 | Tragic 15.2% |
| Immigrants | Senegal | 0.0 /100 | #289 | Tragic 15.3% |
| Senegalese | 0.0 /100 | #290 | Tragic 15.4% |
| Hondurans | 0.0 /100 | #291 | Tragic 15.5% |
| Alaska Natives | 0.0 /100 | #292 | Tragic 15.6% |
| Vietnamese | 0.0 /100 | #293 | Tragic 15.7% |
| Immigrants | Latin America | 0.0 /100 | #294 | Tragic 15.7% |
| Immigrants | Honduras | 0.0 /100 | #295 | Tragic 15.7% |
| Tsimshian | 0.0 /100 | #296 | Tragic 15.7% |
| Immigrants | Bahamas | 0.0 /100 | #297 | Tragic 15.8% |
| Immigrants | Trinidad and Tobago | 0.0 /100 | #298 | Tragic 15.8% |
| Hispanics or Latinos | 0.0 /100 | #299 | Tragic 15.8% |
| Immigrants | Bangladesh | 0.0 /100 | #300 | Tragic 15.9% |
| Trinidadians and Tobagonians | 0.0 /100 | #301 | Tragic 16.0% |
| Immigrants | West Indies | 0.0 /100 | #302 | Tragic 16.1% |
| Nicaraguans | 0.0 /100 | #303 | Tragic 16.1% |
| West Indians | 0.0 /100 | #304 | Tragic 16.3% |
| Immigrants | Azores | 0.0 /100 | #305 | Tragic 16.4% |