Danish vs Dominican Receiving Food Stamps
COMPARE
Danish
Dominican
Receiving Food Stamps
Receiving Food Stamps Comparison
Danes
Dominicans
9.0%
RECEIVING FOOD STAMPS
99.9/ 100
METRIC RATING
18th/ 347
METRIC RANK
21.4%
RECEIVING FOOD STAMPS
0.0/ 100
METRIC RATING
338th/ 347
METRIC RANK
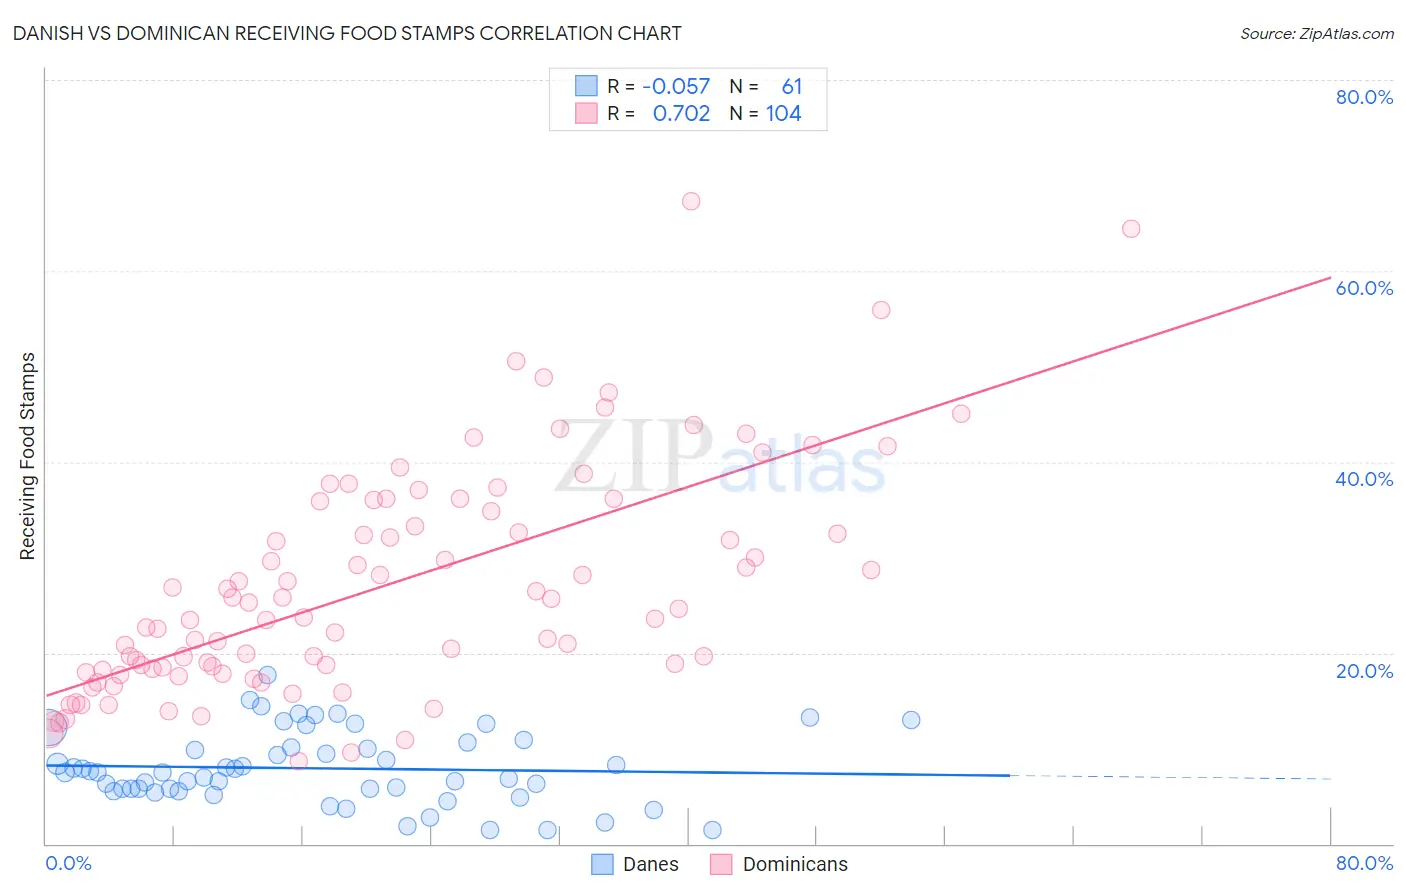
Danish vs Dominican Receiving Food Stamps Correlation Chart
The statistical analysis conducted on geographies consisting of 472,155,016 people shows a slight negative correlation between the proportion of Danes and percentage of population receiving government assistance and/or food stamps in the United States with a correlation coefficient (R) of -0.057 and weighted average of 9.0%. Similarly, the statistical analysis conducted on geographies consisting of 353,995,756 people shows a strong positive correlation between the proportion of Dominicans and percentage of population receiving government assistance and/or food stamps in the United States with a correlation coefficient (R) of 0.702 and weighted average of 21.4%, a difference of 136.4%.
Receiving Food Stamps Correlation Summary
| Measurement | Danish | Dominican |
| Minimum | 1.4% | 8.7% |
| Maximum | 17.7% | 67.3% |
| Range | 16.3% | 58.6% |
| Mean | 7.9% | 27.0% |
| Median | 7.4% | 24.1% |
| Interquartile 25% (IQ1) | 5.6% | 18.3% |
| Interquartile 75% (IQ3) | 10.4% | 35.4% |
| Interquartile Range (IQR) | 4.8% | 17.1% |
| Standard Deviation (Sample) | 3.7% | 11.8% |
| Standard Deviation (Population) | 3.7% | 11.7% |
Similar Demographics by Receiving Food Stamps
Demographics Similar to Danes by Receiving Food Stamps
In terms of receiving food stamps, the demographic groups most similar to Danes are Immigrants from Scotland (9.0%, a difference of 0.45%), Immigrants from Hong Kong (9.1%, a difference of 0.58%), Immigrants from Japan (9.0%, a difference of 0.61%), Norwegian (9.0%, a difference of 0.88%), and Latvian (9.1%, a difference of 0.91%).
| Demographics | Rating | Rank | Receiving Food Stamps |
| Okinawans | 99.9 /100 | #11 | Exceptional 8.9% |
| Cypriots | 99.9 /100 | #12 | Exceptional 8.9% |
| Bulgarians | 99.9 /100 | #13 | Exceptional 8.9% |
| Maltese | 99.9 /100 | #14 | Exceptional 8.9% |
| Norwegians | 99.9 /100 | #15 | Exceptional 9.0% |
| Immigrants | Japan | 99.9 /100 | #16 | Exceptional 9.0% |
| Immigrants | Scotland | 99.9 /100 | #17 | Exceptional 9.0% |
| Danes | 99.9 /100 | #18 | Exceptional 9.0% |
| Immigrants | Hong Kong | 99.8 /100 | #19 | Exceptional 9.1% |
| Latvians | 99.8 /100 | #20 | Exceptional 9.1% |
| Luxembourgers | 99.8 /100 | #21 | Exceptional 9.1% |
| Immigrants | Australia | 99.8 /100 | #22 | Exceptional 9.2% |
| Eastern Europeans | 99.8 /100 | #23 | Exceptional 9.2% |
| Immigrants | Northern Europe | 99.8 /100 | #24 | Exceptional 9.2% |
| Immigrants | Ireland | 99.8 /100 | #25 | Exceptional 9.2% |
Demographics Similar to Dominicans by Receiving Food Stamps
In terms of receiving food stamps, the demographic groups most similar to Dominicans are Yakama (21.4%, a difference of 0.26%), Tohono O'odham (21.5%, a difference of 0.52%), Hopi (21.6%, a difference of 0.89%), Immigrants from Yemen (21.6%, a difference of 1.3%), and Cape Verdean (21.1%, a difference of 1.4%).
| Demographics | Rating | Rank | Receiving Food Stamps |
| Immigrants | Caribbean | 0.0 /100 | #331 | Tragic 19.6% |
| Pueblo | 0.0 /100 | #332 | Tragic 19.9% |
| Inupiat | 0.0 /100 | #333 | Tragic 20.1% |
| Yuman | 0.0 /100 | #334 | Tragic 20.2% |
| Immigrants | Cuba | 0.0 /100 | #335 | Tragic 20.8% |
| Navajo | 0.0 /100 | #336 | Tragic 21.1% |
| Cape Verdeans | 0.0 /100 | #337 | Tragic 21.1% |
| Dominicans | 0.0 /100 | #338 | Tragic 21.4% |
| Yakama | 0.0 /100 | #339 | Tragic 21.4% |
| Tohono O'odham | 0.0 /100 | #340 | Tragic 21.5% |
| Hopi | 0.0 /100 | #341 | Tragic 21.6% |
| Immigrants | Yemen | 0.0 /100 | #342 | Tragic 21.6% |
| Immigrants | Dominican Republic | 0.0 /100 | #343 | Tragic 22.1% |
| Lumbee | 0.0 /100 | #344 | Tragic 22.9% |
| Immigrants | Cabo Verde | 0.0 /100 | #345 | Tragic 23.8% |