Senegalese vs English Receiving Food Stamps
COMPARE
Senegalese
English
Receiving Food Stamps
Receiving Food Stamps Comparison
Senegalese
English
15.4%
RECEIVING FOOD STAMPS
0.0/ 100
METRIC RATING
290th/ 347
METRIC RANK
9.8%
RECEIVING FOOD STAMPS
99.2/ 100
METRIC RATING
61st/ 347
METRIC RANK
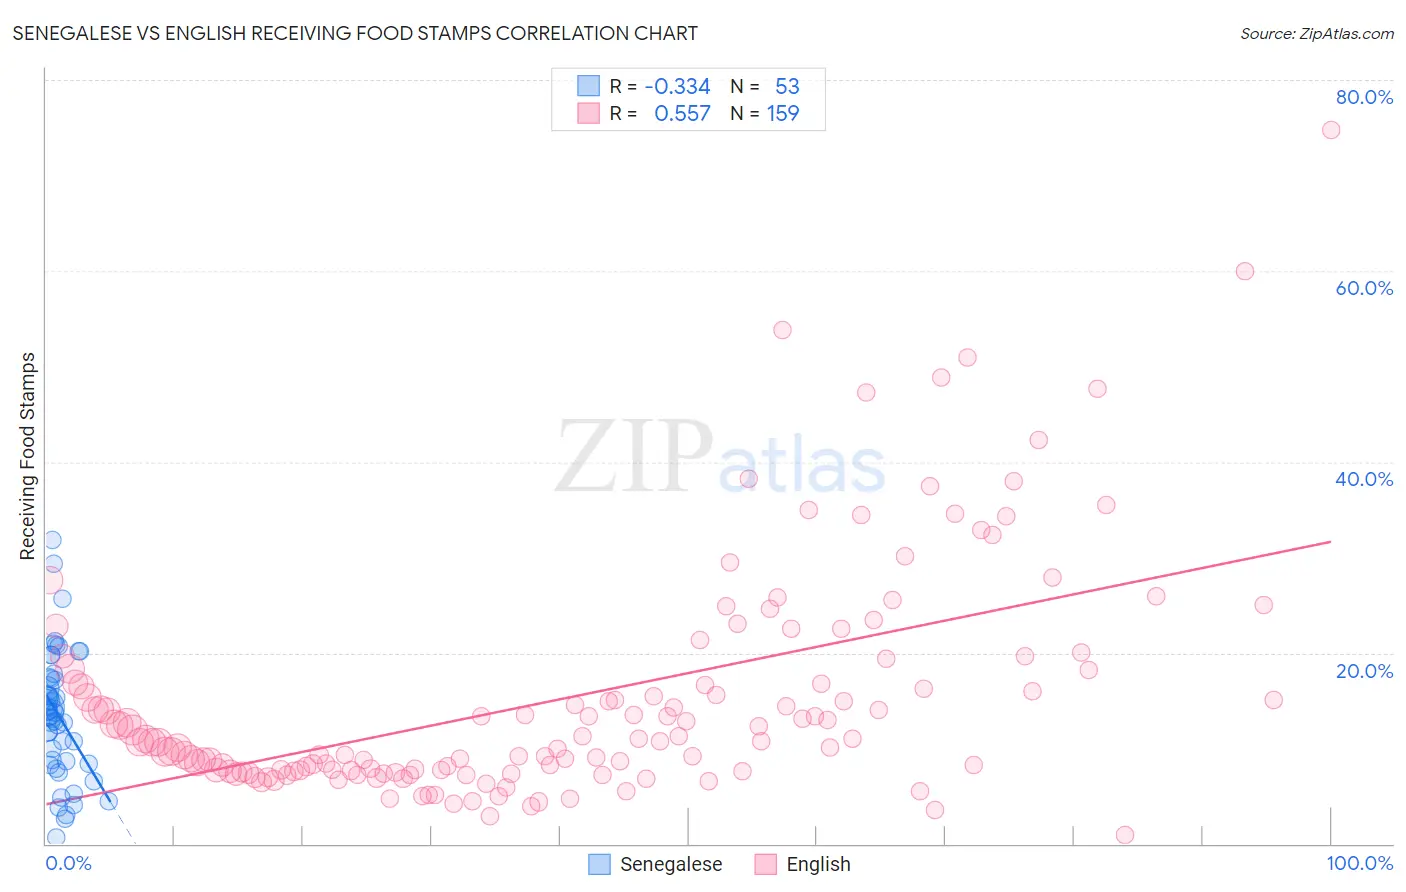
Senegalese vs English Receiving Food Stamps Correlation Chart
The statistical analysis conducted on geographies consisting of 78,101,043 people shows a mild negative correlation between the proportion of Senegalese and percentage of population receiving government assistance and/or food stamps in the United States with a correlation coefficient (R) of -0.334 and weighted average of 15.4%. Similarly, the statistical analysis conducted on geographies consisting of 575,562,331 people shows a substantial positive correlation between the proportion of English and percentage of population receiving government assistance and/or food stamps in the United States with a correlation coefficient (R) of 0.557 and weighted average of 9.8%, a difference of 57.7%.
Receiving Food Stamps Correlation Summary
| Measurement | Senegalese | English |
| Minimum | 0.60% | 0.90% |
| Maximum | 31.8% | 74.8% |
| Range | 31.2% | 73.9% |
| Mean | 13.5% | 15.3% |
| Median | 13.7% | 10.8% |
| Interquartile 25% (IQ1) | 8.6% | 7.6% |
| Interquartile 75% (IQ3) | 17.4% | 18.2% |
| Interquartile Range (IQR) | 8.8% | 10.6% |
| Standard Deviation (Sample) | 6.6% | 12.2% |
| Standard Deviation (Population) | 6.5% | 12.1% |
Similar Demographics by Receiving Food Stamps
Demographics Similar to Senegalese by Receiving Food Stamps
In terms of receiving food stamps, the demographic groups most similar to Senegalese are Immigrants from Senegal (15.3%, a difference of 0.27%), Honduran (15.5%, a difference of 1.0%), Immigrants from Belize (15.2%, a difference of 1.0%), Alaska Native (15.6%, a difference of 1.5%), and Immigrants from Mexico (15.2%, a difference of 1.5%).
| Demographics | Rating | Rank | Receiving Food Stamps |
| Bangladeshis | 0.0 /100 | #283 | Tragic 15.0% |
| Immigrants | Ecuador | 0.0 /100 | #284 | Tragic 15.0% |
| Immigrants | Liberia | 0.0 /100 | #285 | Tragic 15.1% |
| Africans | 0.0 /100 | #286 | Tragic 15.1% |
| Immigrants | Mexico | 0.0 /100 | #287 | Tragic 15.2% |
| Immigrants | Belize | 0.0 /100 | #288 | Tragic 15.2% |
| Immigrants | Senegal | 0.0 /100 | #289 | Tragic 15.3% |
| Senegalese | 0.0 /100 | #290 | Tragic 15.4% |
| Hondurans | 0.0 /100 | #291 | Tragic 15.5% |
| Alaska Natives | 0.0 /100 | #292 | Tragic 15.6% |
| Vietnamese | 0.0 /100 | #293 | Tragic 15.7% |
| Immigrants | Latin America | 0.0 /100 | #294 | Tragic 15.7% |
| Immigrants | Honduras | 0.0 /100 | #295 | Tragic 15.7% |
| Tsimshian | 0.0 /100 | #296 | Tragic 15.7% |
| Immigrants | Bahamas | 0.0 /100 | #297 | Tragic 15.8% |
Demographics Similar to English by Receiving Food Stamps
In terms of receiving food stamps, the demographic groups most similar to English are Immigrants from Bulgaria (9.8%, a difference of 0.080%), Chinese (9.8%, a difference of 0.11%), German (9.7%, a difference of 0.14%), Immigrants from North America (9.8%, a difference of 0.19%), and British (9.7%, a difference of 0.24%).
| Demographics | Rating | Rank | Receiving Food Stamps |
| Swiss | 99.3 /100 | #54 | Exceptional 9.7% |
| Immigrants | Switzerland | 99.3 /100 | #55 | Exceptional 9.7% |
| Immigrants | Canada | 99.3 /100 | #56 | Exceptional 9.7% |
| Greeks | 99.3 /100 | #57 | Exceptional 9.7% |
| Scandinavians | 99.2 /100 | #58 | Exceptional 9.7% |
| British | 99.2 /100 | #59 | Exceptional 9.7% |
| Germans | 99.2 /100 | #60 | Exceptional 9.7% |
| English | 99.2 /100 | #61 | Exceptional 9.8% |
| Immigrants | Bulgaria | 99.2 /100 | #62 | Exceptional 9.8% |
| Chinese | 99.2 /100 | #63 | Exceptional 9.8% |
| Immigrants | North America | 99.2 /100 | #64 | Exceptional 9.8% |
| Immigrants | Turkey | 99.1 /100 | #65 | Exceptional 9.8% |
| Slovenes | 99.1 /100 | #66 | Exceptional 9.8% |
| Immigrants | Indonesia | 99.0 /100 | #67 | Exceptional 9.8% |
| Northern Europeans | 99.0 /100 | #68 | Exceptional 9.8% |