Senegalese vs Tlingit-Haida Receiving Food Stamps
COMPARE
Senegalese
Tlingit-Haida
Receiving Food Stamps
Receiving Food Stamps Comparison
Senegalese
Tlingit-Haida
15.4%
RECEIVING FOOD STAMPS
0.0/ 100
METRIC RATING
290th/ 347
METRIC RANK
11.6%
RECEIVING FOOD STAMPS
59.1/ 100
METRIC RATING
168th/ 347
METRIC RANK
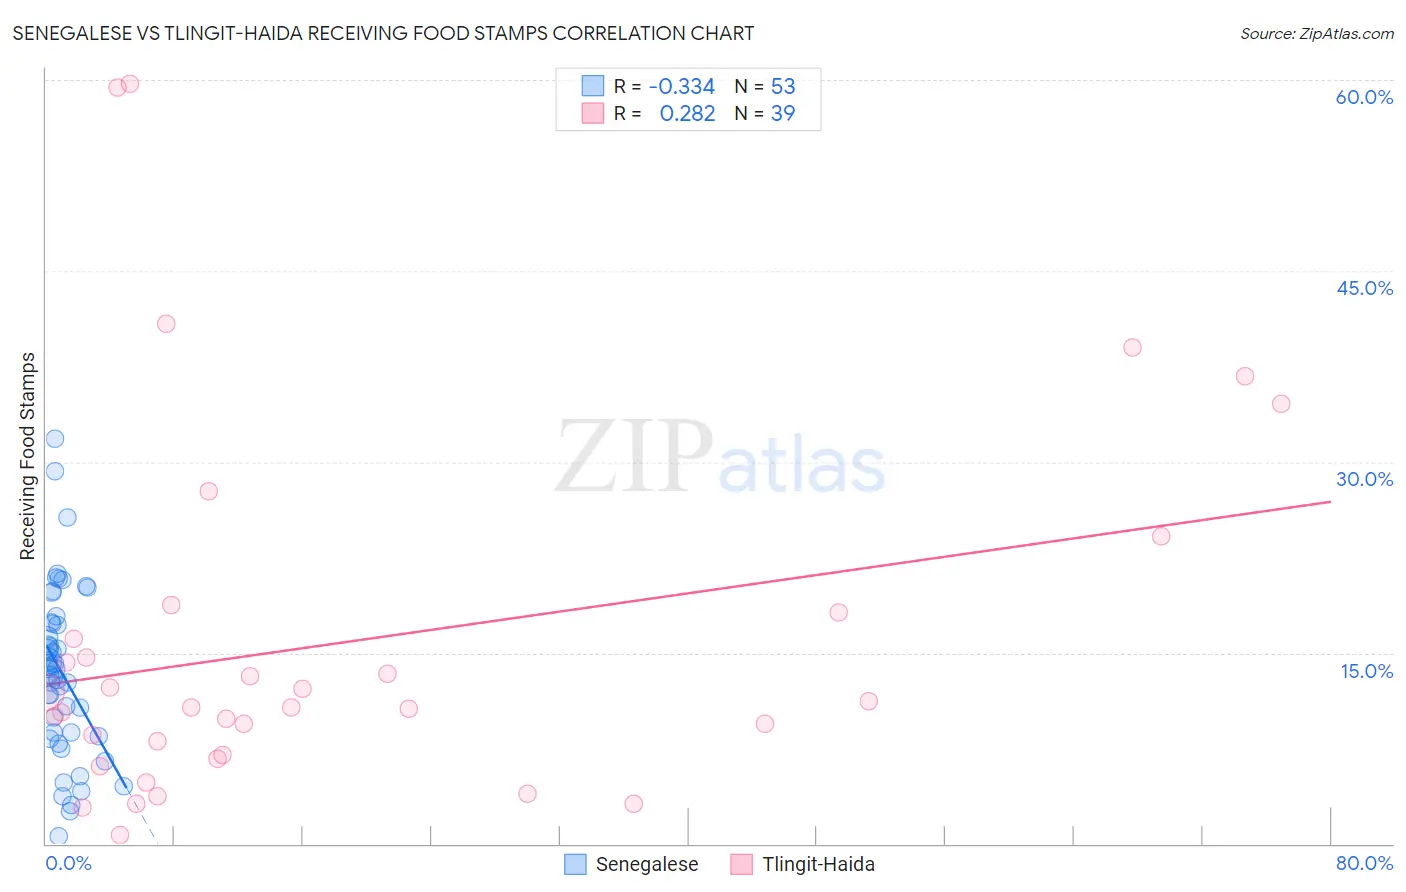
Senegalese vs Tlingit-Haida Receiving Food Stamps Correlation Chart
The statistical analysis conducted on geographies consisting of 78,101,043 people shows a mild negative correlation between the proportion of Senegalese and percentage of population receiving government assistance and/or food stamps in the United States with a correlation coefficient (R) of -0.334 and weighted average of 15.4%. Similarly, the statistical analysis conducted on geographies consisting of 60,831,023 people shows a weak positive correlation between the proportion of Tlingit-Haida and percentage of population receiving government assistance and/or food stamps in the United States with a correlation coefficient (R) of 0.282 and weighted average of 11.6%, a difference of 32.8%.
Receiving Food Stamps Correlation Summary
| Measurement | Senegalese | Tlingit-Haida |
| Minimum | 0.60% | 0.70% |
| Maximum | 31.8% | 59.7% |
| Range | 31.2% | 59.0% |
| Mean | 13.5% | 15.8% |
| Median | 13.7% | 10.7% |
| Interquartile 25% (IQ1) | 8.6% | 7.0% |
| Interquartile 75% (IQ3) | 17.4% | 18.2% |
| Interquartile Range (IQR) | 8.8% | 11.2% |
| Standard Deviation (Sample) | 6.6% | 14.4% |
| Standard Deviation (Population) | 6.5% | 14.2% |
Similar Demographics by Receiving Food Stamps
Demographics Similar to Senegalese by Receiving Food Stamps
In terms of receiving food stamps, the demographic groups most similar to Senegalese are Immigrants from Senegal (15.3%, a difference of 0.27%), Honduran (15.5%, a difference of 1.0%), Immigrants from Belize (15.2%, a difference of 1.0%), Alaska Native (15.6%, a difference of 1.5%), and Immigrants from Mexico (15.2%, a difference of 1.5%).
| Demographics | Rating | Rank | Receiving Food Stamps |
| Bangladeshis | 0.0 /100 | #283 | Tragic 15.0% |
| Immigrants | Ecuador | 0.0 /100 | #284 | Tragic 15.0% |
| Immigrants | Liberia | 0.0 /100 | #285 | Tragic 15.1% |
| Africans | 0.0 /100 | #286 | Tragic 15.1% |
| Immigrants | Mexico | 0.0 /100 | #287 | Tragic 15.2% |
| Immigrants | Belize | 0.0 /100 | #288 | Tragic 15.2% |
| Immigrants | Senegal | 0.0 /100 | #289 | Tragic 15.3% |
| Senegalese | 0.0 /100 | #290 | Tragic 15.4% |
| Hondurans | 0.0 /100 | #291 | Tragic 15.5% |
| Alaska Natives | 0.0 /100 | #292 | Tragic 15.6% |
| Vietnamese | 0.0 /100 | #293 | Tragic 15.7% |
| Immigrants | Latin America | 0.0 /100 | #294 | Tragic 15.7% |
| Immigrants | Honduras | 0.0 /100 | #295 | Tragic 15.7% |
| Tsimshian | 0.0 /100 | #296 | Tragic 15.7% |
| Immigrants | Bahamas | 0.0 /100 | #297 | Tragic 15.8% |
Demographics Similar to Tlingit-Haida by Receiving Food Stamps
In terms of receiving food stamps, the demographic groups most similar to Tlingit-Haida are Immigrants from Eastern Africa (11.6%, a difference of 0.12%), Kenyan (11.6%, a difference of 0.16%), Costa Rican (11.6%, a difference of 0.18%), Immigrants from Western Asia (11.6%, a difference of 0.40%), and Immigrants from Belarus (11.5%, a difference of 0.54%).
| Demographics | Rating | Rank | Receiving Food Stamps |
| Pennsylvania Germans | 68.4 /100 | #161 | Good 11.4% |
| Alsatians | 68.0 /100 | #162 | Good 11.4% |
| Immigrants | Southern Europe | 65.8 /100 | #163 | Good 11.5% |
| Immigrants | Chile | 65.0 /100 | #164 | Good 11.5% |
| Arabs | 64.7 /100 | #165 | Good 11.5% |
| Immigrants | Belarus | 62.8 /100 | #166 | Good 11.5% |
| Kenyans | 60.2 /100 | #167 | Good 11.6% |
| Tlingit-Haida | 59.1 /100 | #168 | Average 11.6% |
| Immigrants | Eastern Africa | 58.3 /100 | #169 | Average 11.6% |
| Costa Ricans | 57.9 /100 | #170 | Average 11.6% |
| Immigrants | Western Asia | 56.4 /100 | #171 | Average 11.6% |
| Guamanians/Chamorros | 54.2 /100 | #172 | Average 11.7% |
| Immigrants | Syria | 53.4 /100 | #173 | Average 11.7% |
| Immigrants | Eritrea | 50.0 /100 | #174 | Average 11.7% |
| Osage | 49.8 /100 | #175 | Average 11.7% |