Seminole vs Immigrants from Northern Europe 2nd Grade

COMPARE

Seminole
Race
Ancestry
AfghanAfricanAlaska NativeAlaskan AthabascanAlbanianAleutAlsatianAmericanApacheArabArapahoArgentineanArmenianAssyrian/Chaldean/SyriacAustralianAustrianBahamianBangladeshiBarbadianBasqueBelgianBelizeanBermudanBhutaneseBlackfeetBolivianBrazilianBritishBritish West IndianBulgarianBurmeseCajunCambodianCanadianCape VerdeanCarpatho RusynCelticCentral AmericanCentral American IndianCherokeeCheyenneChickasawChileanChineseChippewaChoctawColombianColvilleComancheCosta RicanCreeCreekCroatianCrowCubanCypriotCzechCzechoslovakianDanishDelawareDominicanDutchDutch West IndianEastern EuropeanEcuadorianEgyptianEnglishEstonianEthiopianEuropeanFijianFilipinoFinnishFrenchFrench American IndianFrench CanadianGermanGerman RussianGhanaianGreekGuamanian/ChamorroGuatemalanGuyaneseHaitianHmongHonduranHopiHoumaHungarianIcelanderIndian (Asian)IndonesianInupiatIranianIraqiIrishIroquoisIsraeliItalianJamaicanJapaneseJordanianKenyanKiowaKoreanLaotianLatvianLebaneseLiberianLithuanianLumbeeLuxembourgerMacedonianMalaysianMalteseMarshalleseMenomineeMexicanMexican American IndianMongolianMoroccanNative HawaiianNavajoNepaleseNew ZealanderNicaraguanNigerianNorthern EuropeanNorwegianOkinawanOsageOttawaPaiutePakistaniPalestinianPanamanianParaguayanPennsylvania GermanPeruvianPimaPolishPortuguesePotawatomiPuebloPuerto RicanPuget Sound SalishRomanianRussianSalvadoranSamoanScandinavianScotch-IrishScottishSeminoleSenegaleseSerbianShoshoneSierra LeoneanSiouxSlavicSlovakSloveneSomaliSouth AfricanSouth AmericanSouth American IndianSoviet UnionSpaniardSpanishSpanish AmericanSpanish American IndianSri LankanSubsaharan AfricanSudaneseSwedishSwissSyrianTaiwaneseThaiTlingit-HaidaTohono O'OdhamTonganTrinidadian and TobagonianTsimshianTurkishU.S. Virgin IslanderUgandanUkrainianUruguayanUteVenezuelanVietnameseWelshWest IndianYakamaYaquiYugoslavianYumanYup'ikZimbabwean
Immigration
NonimmigrantsImmigrantsAfghanistanAfricaAlbaniaArgentinaArmeniaAsiaAustraliaAustriaBahamasBangladeshBarbadosBelarusBelgiumBelizeBoliviaBosnia and HerzegovinaBrazilBulgariaBurma/MyanmarCabo VerdeCambodiaCameroonCanadaCaribbeanCentral AmericaChileChinaColombiaCongoCosta RicaCroatiaCubaCzechoslovakiaDenmarkDominicaDominican RepublicEastern AfricaEastern AsiaEastern EuropeEcuadorEgyptEl SalvadorEnglandEritreaEthiopiaEuropeFijiFranceGermanyGhanaGreeceGrenadaGuatemalaGuyanaHaitiHondurasHong KongHungaryIndiaIndonesiaIranIraqIrelandIsraelItalyJamaicaJapanJordanKazakhstanKenyaKoreaKuwaitLaosLatin AmericaLatviaLebanonLiberiaLithuaniaMalaysiaMexicoMicronesiaMiddle AfricaMoldovaMoroccoNepalNetherlandsNicaraguaNigeriaNorth AmericaNorth MacedoniaNorthern AfricaNorwayOceaniaPakistanPanamaPeruPhilippinesPolandPortugalRomaniaRussiaSaudi ArabiaScotlandSenegalSerbiaSierra LeoneSingaporeSomaliaSouth AfricaSouth AmericaSouth Central AsiaSouth Eastern AsiaSouthern EuropeSpainSri LankaSt. Vincent and the GrenadinesSudanSwedenSwitzerlandSyriaTaiwanThailandTrinidad and TobagoTurkeyUgandaUkraineUruguayUzbekistanVenezuelaVietnamWest IndiesWestern AfricaWestern AsiaWestern EuropeYemenZaireZimbabweAzores
Immigrants from Northern Europe
Race
Ancestry
AfghanAfricanAlaska NativeAlaskan AthabascanAlbanianAleutAlsatianAmericanApacheArabArapahoArgentineanArmenianAssyrian/Chaldean/SyriacAustralianAustrianBahamianBangladeshiBarbadianBasqueBelgianBelizeanBermudanBhutaneseBlackfeetBolivianBrazilianBritishBritish West IndianBulgarianBurmeseCajunCambodianCanadianCape VerdeanCarpatho RusynCelticCentral AmericanCentral American IndianCherokeeCheyenneChickasawChileanChineseChippewaChoctawColombianColvilleComancheCosta RicanCreeCreekCroatianCrowCubanCypriotCzechCzechoslovakianDanishDelawareDominicanDutchDutch West IndianEastern EuropeanEcuadorianEgyptianEnglishEstonianEthiopianEuropeanFijianFilipinoFinnishFrenchFrench American IndianFrench CanadianGermanGerman RussianGhanaianGreekGuamanian/ChamorroGuatemalanGuyaneseHaitianHmongHonduranHopiHoumaHungarianIcelanderIndian (Asian)IndonesianInupiatIranianIraqiIrishIroquoisIsraeliItalianJamaicanJapaneseJordanianKenyanKiowaKoreanLaotianLatvianLebaneseLiberianLithuanianLumbeeLuxembourgerMacedonianMalaysianMalteseMarshalleseMenomineeMexicanMexican American IndianMongolianMoroccanNative HawaiianNavajoNepaleseNew ZealanderNicaraguanNigerianNorthern EuropeanNorwegianOkinawanOsageOttawaPaiutePakistaniPalestinianPanamanianParaguayanPennsylvania GermanPeruvianPimaPolishPortuguesePotawatomiPuebloPuerto RicanPuget Sound SalishRomanianRussianSalvadoranSamoanScandinavianScotch-IrishScottishSenegaleseSerbianShoshoneSierra LeoneanSiouxSlavicSlovakSloveneSomaliSouth AfricanSouth AmericanSouth American IndianSoviet UnionSpaniardSpanishSpanish AmericanSpanish American IndianSri LankanSubsaharan AfricanSudaneseSwedishSwissSyrianTaiwaneseThaiTlingit-HaidaTohono O'OdhamTonganTrinidadian and TobagonianTsimshianTurkishU.S. Virgin IslanderUgandanUkrainianUruguayanUteVenezuelanVietnameseWelshWest IndianYakamaYaquiYugoslavianYumanYup'ikZimbabwean
Immigration
NonimmigrantsImmigrantsAfghanistanAfricaAlbaniaArgentinaArmeniaAsiaAustraliaAustriaBahamasBangladeshBarbadosBelarusBelgiumBelizeBoliviaBosnia and HerzegovinaBrazilBulgariaBurma/MyanmarCabo VerdeCambodiaCameroonCanadaCaribbeanCentral AmericaChileChinaColombiaCongoCosta RicaCroatiaCubaCzechoslovakiaDenmarkDominicaDominican RepublicEastern AfricaEastern AsiaEastern EuropeEcuadorEgyptEl SalvadorEnglandEritreaEthiopiaEuropeFijiFranceGermanyGhanaGreeceGrenadaGuatemalaGuyanaHaitiHondurasHong KongHungaryIndiaIndonesiaIranIraqIrelandIsraelItalyJamaicaJapanJordanKazakhstanKenyaKoreaKuwaitLaosLatin AmericaLatviaLebanonLiberiaLithuaniaMalaysiaMexicoMicronesiaMiddle AfricaMoldovaMoroccoNepalNetherlandsNicaraguaNigeriaNorth AmericaNorth MacedoniaNorthern AfricaNorthern EuropeNorwayOceaniaPakistanPanamaPeruPhilippinesPolandPortugalRomaniaRussiaSaudi ArabiaScotlandSenegalSerbiaSierra LeoneSingaporeSomaliaSouth AfricaSouth AmericaSouth Central AsiaSouth Eastern AsiaSouthern EuropeSpainSri LankaSt. Vincent and the GrenadinesSudanSwedenSwitzerlandSyriaTaiwanThailandTrinidad and TobagoTurkeyUgandaUkraineUruguayUzbekistanVenezuelaVietnamWest IndiesWestern AfricaWestern AsiaWestern EuropeYemenZaireZimbabweAzores
2nd Grade
Income
Poverty
Unemployment
Labor Participation
Family Structure
Vehicle Availability
Education Level
Disability

2nd Grade Comparison

Seminole

Immigrants from Northern Europe

Exceptional
Exceptional
98.0%
2ND GRADE
91.1/ 100
METRIC RATING
130th/ 347
METRIC RANK
98.3%
2ND GRADE
99.7/ 100
METRIC RATING
67th/ 347
METRIC RANK

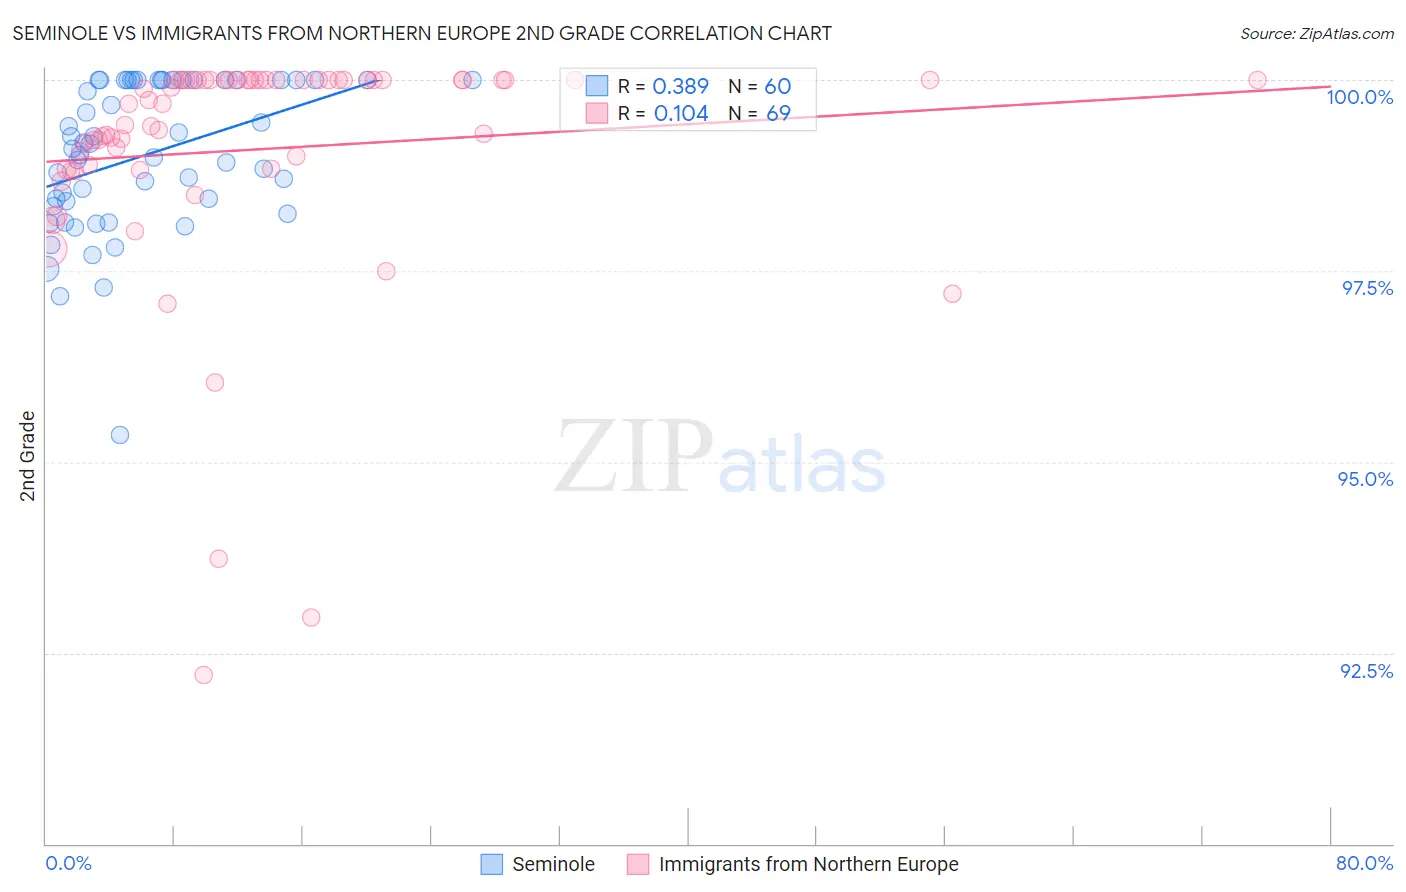
Seminole vs Immigrants from Northern Europe 2nd Grade Correlation Chart

The statistical analysis conducted on geographies consisting of 118,313,258 people shows a mild positive correlation between the proportion of Seminole and percentage of population with at least 2nd grade education in the United States with a correlation coefficient (R) of 0.389 and weighted average of 98.0%. Similarly, the statistical analysis conducted on geographies consisting of 477,226,800 people shows a poor positive correlation between the proportion of Immigrants from Northern Europe and percentage of population with at least 2nd grade education in the United States with a correlation coefficient (R) of 0.104 and weighted average of 98.3%, a difference of 0.26%.
Seminole vs Immigrants from Northern Europe 2nd Grade

2nd Grade Correlation Summary

MeasurementSeminoleImmigrants from Northern Europe
Minimum95.3%92.2%
Maximum100.0%100.0%
Range4.7%7.8%
Mean99.0%99.1%
Median99.1%99.7%
Interquartile 25% (IQ1)98.4%98.8%
Interquartile 75% (IQ3)100.0%100.0%
Interquartile Range (IQR)1.6%1.2%
Standard Deviation (Sample)0.97%1.6%
Standard Deviation (Population)0.96%1.6%

Similar Demographics by 2nd Grade

Demographics Similar to Seminole by 2nd Grade

In terms of 2nd grade, the demographic groups most similar to Seminole are Immigrants from Europe (98.0%, a difference of 0.0%), Spaniard (98.0%, a difference of 0.0%), Cambodian (98.0%, a difference of 0.0%), Immigrants from Serbia (98.1%, a difference of 0.010%), and Immigrants from Croatia (98.1%, a difference of 0.010%).
DemographicsRating | Rank2nd Grade
Immigrants | Japan
94.1
/100
|
#123
Exceptional
98.1%
Menominee
94.1
/100
|
#124
Exceptional
98.1%
Iroquois
94.1
/100
|
#125
Exceptional
98.1%
Syrians
94.0
/100
|
#126
Exceptional
98.1%
Immigrants | Saudi Arabia
93.6
/100
|
#127
Exceptional
98.1%
Immigrants | Serbia
92.3
/100
|
#128
Exceptional
98.1%
Immigrants | Croatia
92.1
/100
|
#129
Exceptional
98.1%
Seminole
91.1
/100
|
#130
Exceptional
98.0%
Immigrants | Europe
91.1
/100
|
#131
Exceptional
98.0%
Spaniards
90.7
/100
|
#132
Exceptional
98.0%
Cambodians
90.7
/100
|
#133
Exceptional
98.0%
Immigrants | Hungary
89.7
/100
|
#134
Excellent
98.0%
Immigrants | Bulgaria
89.7
/100
|
#135
Excellent
98.0%
Immigrants | Kuwait
89.2
/100
|
#136
Excellent
98.0%
Immigrants | Romania
88.3
/100
|
#137
Excellent
98.0%

Demographics Similar to Immigrants from Northern Europe by 2nd Grade

In terms of 2nd grade, the demographic groups most similar to Immigrants from Northern Europe are Canadian (98.3%, a difference of 0.0%), Russian (98.3%, a difference of 0.0%), Immigrants from Austria (98.3%, a difference of 0.0%), Serbian (98.3%, a difference of 0.0%), and Chickasaw (98.3%, a difference of 0.010%).
DemographicsRating | Rank2nd Grade
Creek
99.8
/100
|
#60
Exceptional
98.3%
Immigrants | Canada
99.8
/100
|
#61
Exceptional
98.3%
Greeks
99.8
/100
|
#62
Exceptional
98.3%
Maltese
99.7
/100
|
#63
Exceptional
98.3%
Immigrants | North America
99.7
/100
|
#64
Exceptional
98.3%
New Zealanders
99.7
/100
|
#65
Exceptional
98.3%
Canadians
99.7
/100
|
#66
Exceptional
98.3%
Immigrants | Northern Europe
99.7
/100
|
#67
Exceptional
98.3%
Russians
99.7
/100
|
#68
Exceptional
98.3%
Immigrants | Austria
99.6
/100
|
#69
Exceptional
98.3%
Serbians
99.6
/100
|
#70
Exceptional
98.3%
Chickasaw
99.6
/100
|
#71
Exceptional
98.3%
Cheyenne
99.6
/100
|
#72
Exceptional
98.3%
Cajuns
99.5
/100
|
#73
Exceptional
98.3%
Immigrants | Netherlands
99.4
/100
|
#74
Exceptional
98.3%