Seminole vs Immigrants from Nepal Hearing Disability
COMPARE
Seminole
Immigrants from Nepal
Hearing Disability
Hearing Disability Comparison
Seminole
Immigrants from Nepal
4.1%
HEARING DISABILITY
0.0/ 100
METRIC RATING
322nd/ 347
METRIC RANK
2.7%
HEARING DISABILITY
98.3/ 100
METRIC RATING
65th/ 347
METRIC RANK
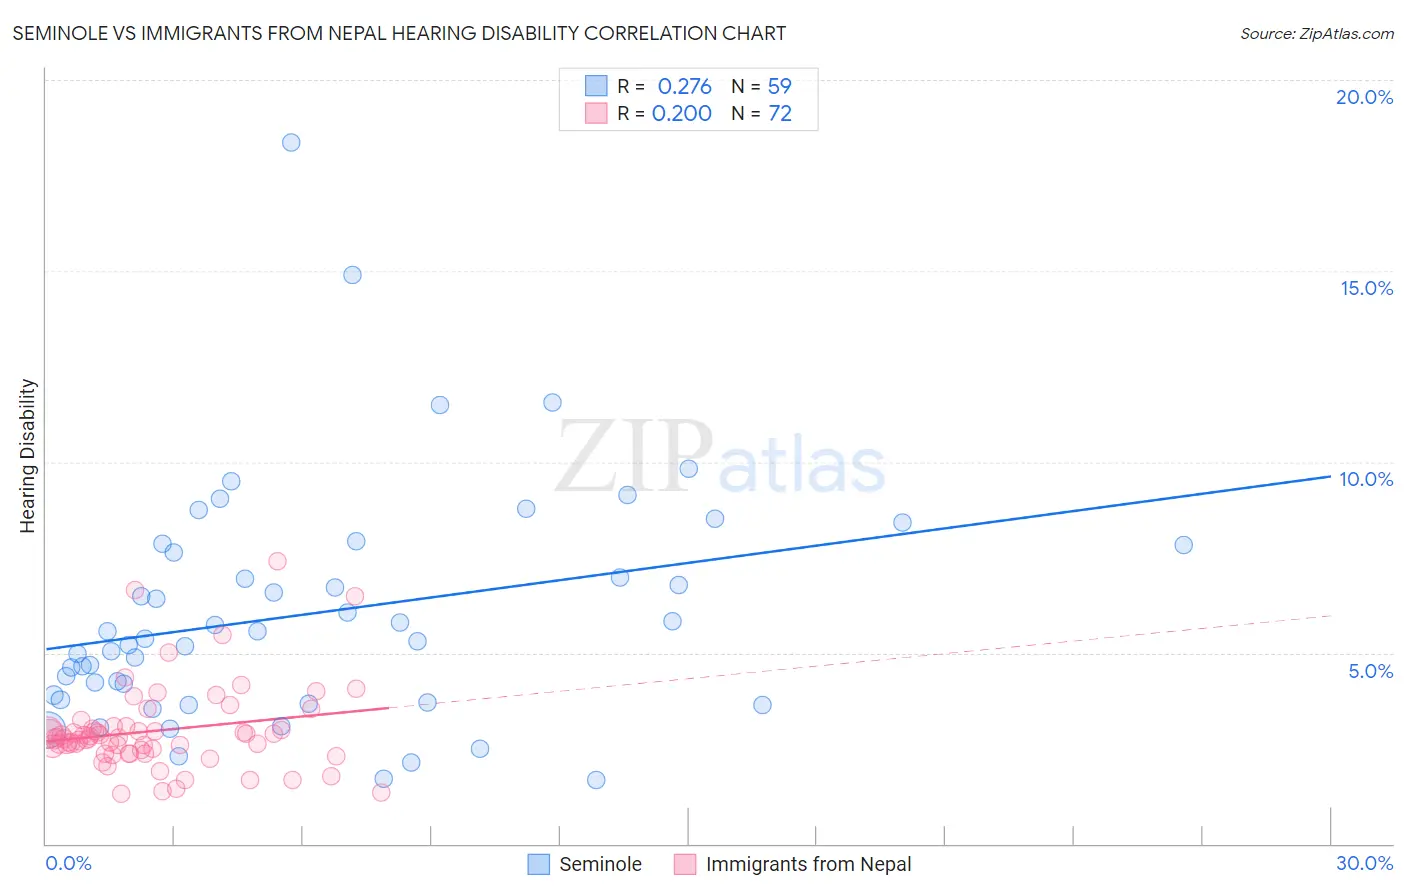
Seminole vs Immigrants from Nepal Hearing Disability Correlation Chart
The statistical analysis conducted on geographies consisting of 118,281,320 people shows a weak positive correlation between the proportion of Seminole and percentage of population with hearing disability in the United States with a correlation coefficient (R) of 0.276 and weighted average of 4.1%. Similarly, the statistical analysis conducted on geographies consisting of 186,754,465 people shows a weak positive correlation between the proportion of Immigrants from Nepal and percentage of population with hearing disability in the United States with a correlation coefficient (R) of 0.200 and weighted average of 2.7%, a difference of 50.8%.
Hearing Disability Correlation Summary
| Measurement | Seminole | Immigrants from Nepal |
| Minimum | 1.7% | 1.3% |
| Maximum | 18.4% | 7.4% |
| Range | 16.7% | 6.1% |
| Mean | 6.0% | 3.0% |
| Median | 5.4% | 2.8% |
| Interquartile 25% (IQ1) | 3.8% | 2.4% |
| Interquartile 75% (IQ3) | 7.8% | 3.0% |
| Interquartile Range (IQR) | 4.0% | 0.63% |
| Standard Deviation (Sample) | 3.1% | 1.1% |
| Standard Deviation (Population) | 3.1% | 1.1% |
Similar Demographics by Hearing Disability
Demographics Similar to Seminole by Hearing Disability
In terms of hearing disability, the demographic groups most similar to Seminole are Apache (4.1%, a difference of 0.12%), Osage (4.1%, a difference of 0.19%), Paiute (4.1%, a difference of 0.26%), Lumbee (4.1%, a difference of 0.51%), and Potawatomi (4.1%, a difference of 0.80%).
| Demographics | Rating | Rank | Hearing Disability |
| Puget Sound Salish | 0.0 /100 | #315 | Tragic 3.9% |
| Spanish Americans | 0.0 /100 | #316 | Tragic 4.0% |
| Comanche | 0.0 /100 | #317 | Tragic 4.0% |
| Cheyenne | 0.0 /100 | #318 | Tragic 4.0% |
| Chippewa | 0.0 /100 | #319 | Tragic 4.0% |
| Shoshone | 0.0 /100 | #320 | Tragic 4.0% |
| Paiute | 0.0 /100 | #321 | Tragic 4.1% |
| Seminole | 0.0 /100 | #322 | Tragic 4.1% |
| Apache | 0.0 /100 | #323 | Tragic 4.1% |
| Osage | 0.0 /100 | #324 | Tragic 4.1% |
| Lumbee | 0.0 /100 | #325 | Tragic 4.1% |
| Potawatomi | 0.0 /100 | #326 | Tragic 4.1% |
| Arapaho | 0.0 /100 | #327 | Tragic 4.1% |
| Tohono O'odham | 0.0 /100 | #328 | Tragic 4.2% |
| Crow | 0.0 /100 | #329 | Tragic 4.2% |
Demographics Similar to Immigrants from Nepal by Hearing Disability
In terms of hearing disability, the demographic groups most similar to Immigrants from Nepal are Immigrants from Sri Lanka (2.7%, a difference of 0.080%), Immigrants from Belize (2.7%, a difference of 0.12%), Indian (Asian) (2.7%, a difference of 0.14%), Immigrants from Uzbekistan (2.7%, a difference of 0.19%), and Immigrants from Colombia (2.7%, a difference of 0.19%).
| Demographics | Rating | Rank | Hearing Disability |
| Immigrants | Peru | 98.6 /100 | #58 | Exceptional 2.7% |
| Immigrants | Eritrea | 98.5 /100 | #59 | Exceptional 2.7% |
| Immigrants | Egypt | 98.5 /100 | #60 | Exceptional 2.7% |
| Immigrants | Uzbekistan | 98.4 /100 | #61 | Exceptional 2.7% |
| Immigrants | Colombia | 98.4 /100 | #62 | Exceptional 2.7% |
| Indians (Asian) | 98.4 /100 | #63 | Exceptional 2.7% |
| Immigrants | Sri Lanka | 98.4 /100 | #64 | Exceptional 2.7% |
| Immigrants | Nepal | 98.3 /100 | #65 | Exceptional 2.7% |
| Immigrants | Belize | 98.2 /100 | #66 | Exceptional 2.7% |
| Egyptians | 98.1 /100 | #67 | Exceptional 2.7% |
| Immigrants | Africa | 98.0 /100 | #68 | Exceptional 2.7% |
| Nicaraguans | 97.9 /100 | #69 | Exceptional 2.7% |
| Peruvians | 97.7 /100 | #70 | Exceptional 2.7% |
| Central Americans | 97.7 /100 | #71 | Exceptional 2.7% |
| Afghans | 97.6 /100 | #72 | Exceptional 2.7% |