Seminole vs Immigrants from Bosnia and Herzegovina 12th Grade, No Diploma
COMPARE
Seminole
Immigrants from Bosnia and Herzegovina
12th Grade, No Diploma
12th Grade, No Diploma Comparison
Seminole
Immigrants from Bosnia and Herzegovina
89.4%
12TH GRADE, NO DIPLOMA
0.2/ 100
METRIC RATING
266th/ 347
METRIC RANK
91.7%
12TH GRADE, NO DIPLOMA
87.3/ 100
METRIC RATING
135th/ 347
METRIC RANK
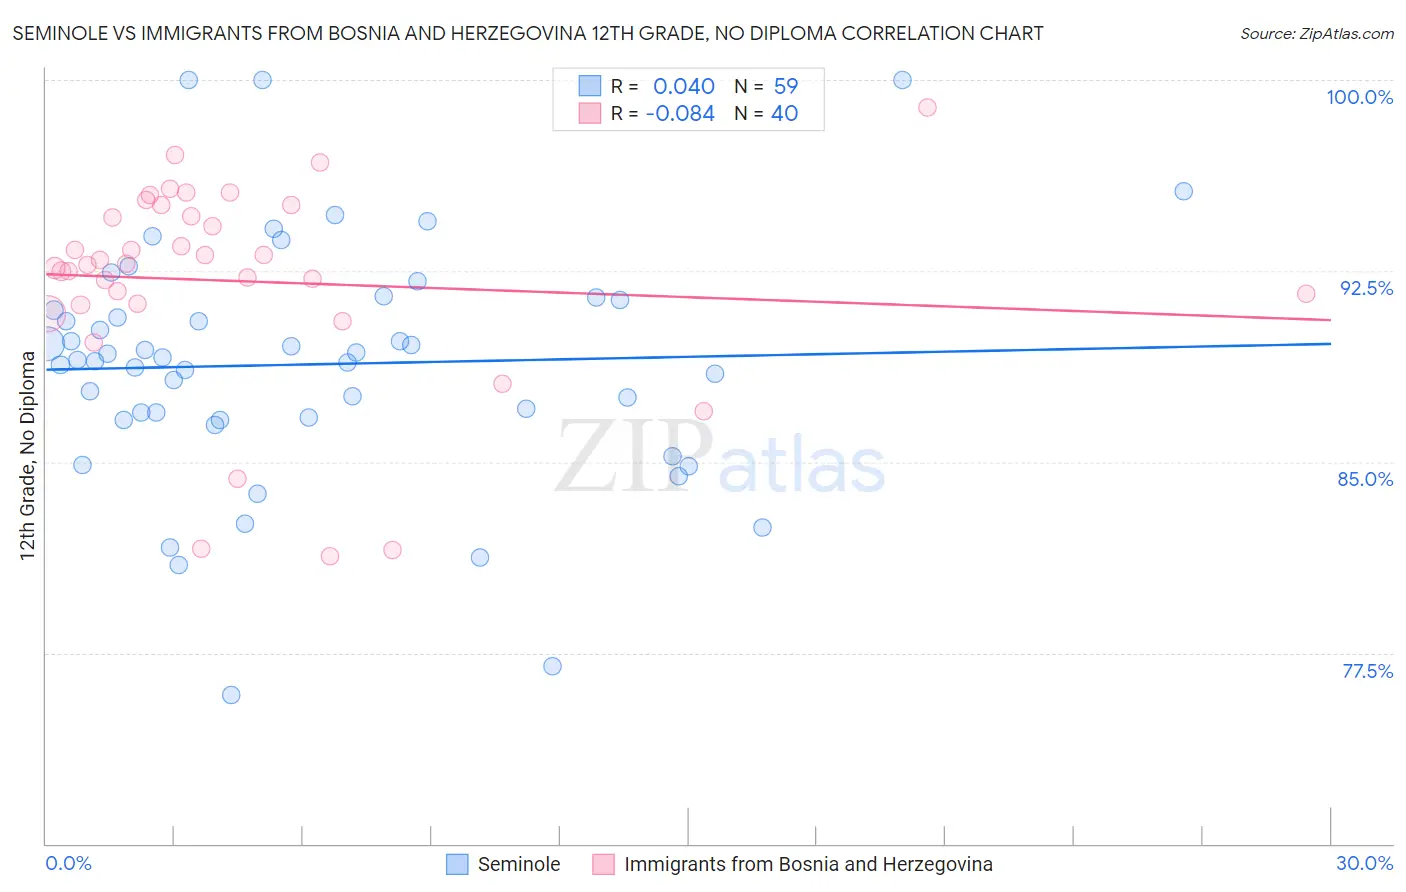
Seminole vs Immigrants from Bosnia and Herzegovina 12th Grade, No Diploma Correlation Chart
The statistical analysis conducted on geographies consisting of 118,313,988 people shows no correlation between the proportion of Seminole and percentage of population with at least 12th grade (no diploma) education in the United States with a correlation coefficient (R) of 0.040 and weighted average of 89.4%. Similarly, the statistical analysis conducted on geographies consisting of 156,819,615 people shows a slight negative correlation between the proportion of Immigrants from Bosnia and Herzegovina and percentage of population with at least 12th grade (no diploma) education in the United States with a correlation coefficient (R) of -0.084 and weighted average of 91.7%, a difference of 2.6%.
12th Grade, No Diploma Correlation Summary
| Measurement | Seminole | Immigrants from Bosnia and Herzegovina |
| Minimum | 75.8% | 81.3% |
| Maximum | 100.0% | 98.9% |
| Range | 24.2% | 17.7% |
| Mean | 88.8% | 92.1% |
| Median | 89.0% | 92.8% |
| Interquartile 25% (IQ1) | 86.7% | 91.2% |
| Interquartile 75% (IQ3) | 91.4% | 94.9% |
| Interquartile Range (IQR) | 4.7% | 3.7% |
| Standard Deviation (Sample) | 4.8% | 4.1% |
| Standard Deviation (Population) | 4.7% | 4.0% |
Similar Demographics by 12th Grade, No Diploma
Demographics Similar to Seminole by 12th Grade, No Diploma
In terms of 12th grade, no diploma, the demographic groups most similar to Seminole are West Indian (89.3%, a difference of 0.010%), Immigrants from Trinidad and Tobago (89.3%, a difference of 0.030%), U.S. Virgin Islander (89.3%, a difference of 0.060%), Trinidadian and Tobagonian (89.4%, a difference of 0.070%), and Sri Lankan (89.4%, a difference of 0.090%).
| Demographics | Rating | Rank | 12th Grade, No Diploma |
| Immigrants | Western Africa | 0.4 /100 | #259 | Tragic 89.6% |
| Immigrants | South Eastern Asia | 0.4 /100 | #260 | Tragic 89.6% |
| Cheyenne | 0.4 /100 | #261 | Tragic 89.6% |
| Sioux | 0.4 /100 | #262 | Tragic 89.6% |
| Immigrants | Jamaica | 0.2 /100 | #263 | Tragic 89.5% |
| Sri Lankans | 0.2 /100 | #264 | Tragic 89.4% |
| Trinidadians and Tobagonians | 0.2 /100 | #265 | Tragic 89.4% |
| Seminole | 0.2 /100 | #266 | Tragic 89.4% |
| West Indians | 0.2 /100 | #267 | Tragic 89.3% |
| Immigrants | Trinidad and Tobago | 0.1 /100 | #268 | Tragic 89.3% |
| U.S. Virgin Islanders | 0.1 /100 | #269 | Tragic 89.3% |
| Bangladeshis | 0.1 /100 | #270 | Tragic 89.3% |
| Blacks/African Americans | 0.1 /100 | #271 | Tragic 89.3% |
| Malaysians | 0.1 /100 | #272 | Tragic 89.2% |
| Barbadians | 0.1 /100 | #273 | Tragic 89.1% |
Demographics Similar to Immigrants from Bosnia and Herzegovina by 12th Grade, No Diploma
In terms of 12th grade, no diploma, the demographic groups most similar to Immigrants from Bosnia and Herzegovina are Immigrants from Italy (91.7%, a difference of 0.030%), Venezuelan (91.7%, a difference of 0.030%), Chilean (91.7%, a difference of 0.040%), Albanian (91.8%, a difference of 0.060%), and Immigrants from Eastern Asia (91.8%, a difference of 0.060%).
| Demographics | Rating | Rank | 12th Grade, No Diploma |
| Mongolians | 89.9 /100 | #128 | Excellent 91.8% |
| German Russians | 89.8 /100 | #129 | Excellent 91.8% |
| Assyrians/Chaldeans/Syriacs | 89.6 /100 | #130 | Excellent 91.8% |
| Albanians | 89.3 /100 | #131 | Excellent 91.8% |
| Immigrants | Eastern Asia | 89.3 /100 | #132 | Excellent 91.8% |
| Immigrants | Italy | 88.3 /100 | #133 | Excellent 91.7% |
| Venezuelans | 88.2 /100 | #134 | Excellent 91.7% |
| Immigrants | Bosnia and Herzegovina | 87.3 /100 | #135 | Excellent 91.7% |
| Chileans | 85.8 /100 | #136 | Excellent 91.7% |
| Alaska Natives | 84.9 /100 | #137 | Excellent 91.6% |
| Arabs | 84.1 /100 | #138 | Excellent 91.6% |
| Immigrants | Egypt | 83.9 /100 | #139 | Excellent 91.6% |
| Immigrants | Poland | 82.3 /100 | #140 | Excellent 91.6% |
| Argentineans | 82.0 /100 | #141 | Excellent 91.6% |
| Immigrants | Venezuela | 80.9 /100 | #142 | Excellent 91.6% |