Seminole vs Immigrants from Belarus Currently Married
COMPARE
Seminole
Immigrants from Belarus
Currently Married
Currently Married Comparison
Seminole
Immigrants from Belarus
44.6%
CURRENTLY MARRIED
0.9/ 100
METRIC RATING
237th/ 347
METRIC RANK
48.1%
CURRENTLY MARRIED
97.2/ 100
METRIC RATING
75th/ 347
METRIC RANK
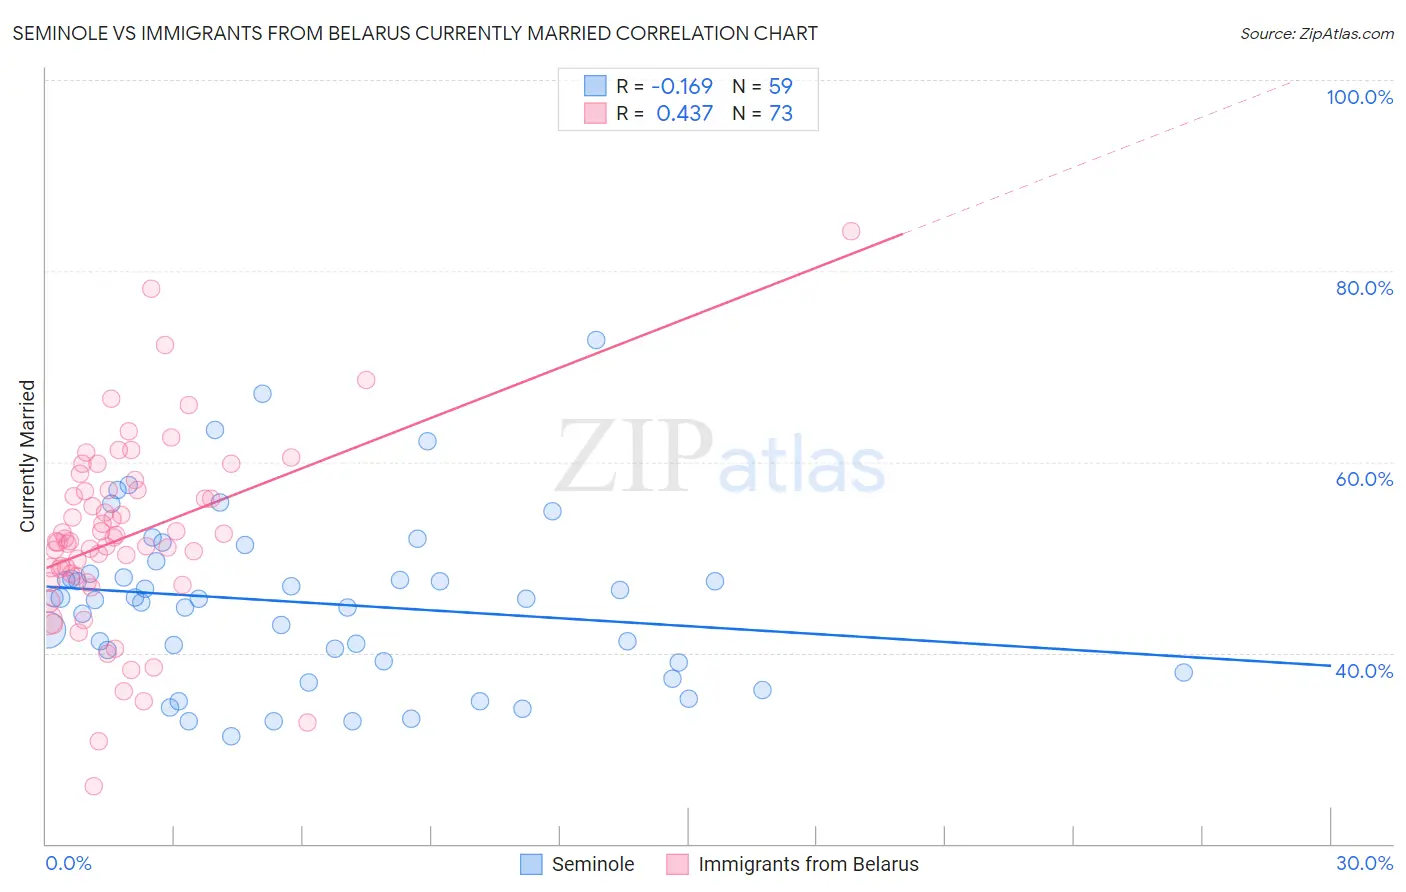
Seminole vs Immigrants from Belarus Currently Married Correlation Chart
The statistical analysis conducted on geographies consisting of 118,313,136 people shows a poor negative correlation between the proportion of Seminole and percentage of population currently married in the United States with a correlation coefficient (R) of -0.169 and weighted average of 44.6%. Similarly, the statistical analysis conducted on geographies consisting of 150,199,360 people shows a moderate positive correlation between the proportion of Immigrants from Belarus and percentage of population currently married in the United States with a correlation coefficient (R) of 0.437 and weighted average of 48.1%, a difference of 7.9%.
Currently Married Correlation Summary
| Measurement | Seminole | Immigrants from Belarus |
| Minimum | 31.2% | 26.0% |
| Maximum | 72.8% | 84.2% |
| Range | 41.6% | 58.2% |
| Mean | 45.3% | 52.2% |
| Median | 45.6% | 51.7% |
| Interquartile 25% (IQ1) | 39.0% | 47.7% |
| Interquartile 75% (IQ3) | 48.3% | 57.0% |
| Interquartile Range (IQR) | 9.3% | 9.3% |
| Standard Deviation (Sample) | 8.9% | 9.9% |
| Standard Deviation (Population) | 8.8% | 9.8% |
Similar Demographics by Currently Married
Demographics Similar to Seminole by Currently Married
In terms of currently married, the demographic groups most similar to Seminole are Cuban (44.6%, a difference of 0.0%), Alaskan Athabascan (44.6%, a difference of 0.010%), Moroccan (44.6%, a difference of 0.080%), Iroquois (44.7%, a difference of 0.17%), and Immigrants from Saudi Arabia (44.7%, a difference of 0.18%).
| Demographics | Rating | Rank | Currently Married |
| Immigrants | Kenya | 1.6 /100 | #230 | Tragic 44.9% |
| Immigrants | Panama | 1.5 /100 | #231 | Tragic 44.9% |
| Nepalese | 1.2 /100 | #232 | Tragic 44.7% |
| Immigrants | Saudi Arabia | 1.1 /100 | #233 | Tragic 44.7% |
| Iroquois | 1.1 /100 | #234 | Tragic 44.7% |
| Alaskan Athabascans | 0.9 /100 | #235 | Tragic 44.6% |
| Cubans | 0.9 /100 | #236 | Tragic 44.6% |
| Seminole | 0.9 /100 | #237 | Tragic 44.6% |
| Moroccans | 0.9 /100 | #238 | Tragic 44.6% |
| Immigrants | Mexico | 0.7 /100 | #239 | Tragic 44.5% |
| Mexican American Indians | 0.7 /100 | #240 | Tragic 44.5% |
| Ethiopians | 0.7 /100 | #241 | Tragic 44.5% |
| Immigrants | Cambodia | 0.7 /100 | #242 | Tragic 44.5% |
| Immigrants | Ethiopia | 0.7 /100 | #243 | Tragic 44.5% |
| Japanese | 0.6 /100 | #244 | Tragic 44.5% |
Demographics Similar to Immigrants from Belarus by Currently Married
In terms of currently married, the demographic groups most similar to Immigrants from Belarus are Basque (48.1%, a difference of 0.020%), Slovene (48.1%, a difference of 0.050%), Immigrants from Belgium (48.1%, a difference of 0.050%), Estonian (48.2%, a difference of 0.070%), and Immigrants from South Africa (48.1%, a difference of 0.070%).
| Demographics | Rating | Rank | Currently Married |
| Immigrants | England | 98.2 /100 | #68 | Exceptional 48.3% |
| Canadians | 98.1 /100 | #69 | Exceptional 48.3% |
| Immigrants | Asia | 97.9 /100 | #70 | Exceptional 48.3% |
| Macedonians | 97.9 /100 | #71 | Exceptional 48.3% |
| Immigrants | Lebanon | 97.6 /100 | #72 | Exceptional 48.2% |
| Immigrants | Eastern Asia | 97.5 /100 | #73 | Exceptional 48.2% |
| Estonians | 97.4 /100 | #74 | Exceptional 48.2% |
| Immigrants | Belarus | 97.2 /100 | #75 | Exceptional 48.1% |
| Basques | 97.2 /100 | #76 | Exceptional 48.1% |
| Slovenes | 97.1 /100 | #77 | Exceptional 48.1% |
| Immigrants | Belgium | 97.1 /100 | #78 | Exceptional 48.1% |
| Immigrants | South Africa | 97.0 /100 | #79 | Exceptional 48.1% |
| Immigrants | Poland | 96.9 /100 | #80 | Exceptional 48.1% |
| Immigrants | Sri Lanka | 96.9 /100 | #81 | Exceptional 48.1% |
| Immigrants | Europe | 96.9 /100 | #82 | Exceptional 48.1% |