Scottish vs Immigrants from South Africa Receiving Food Stamps
COMPARE
Scottish
Immigrants from South Africa
Receiving Food Stamps
Receiving Food Stamps Comparison
Scottish
Immigrants from South Africa
9.9%
RECEIVING FOOD STAMPS
98.9/ 100
METRIC RATING
71st/ 347
METRIC RANK
9.7%
RECEIVING FOOD STAMPS
99.3/ 100
METRIC RATING
52nd/ 347
METRIC RANK
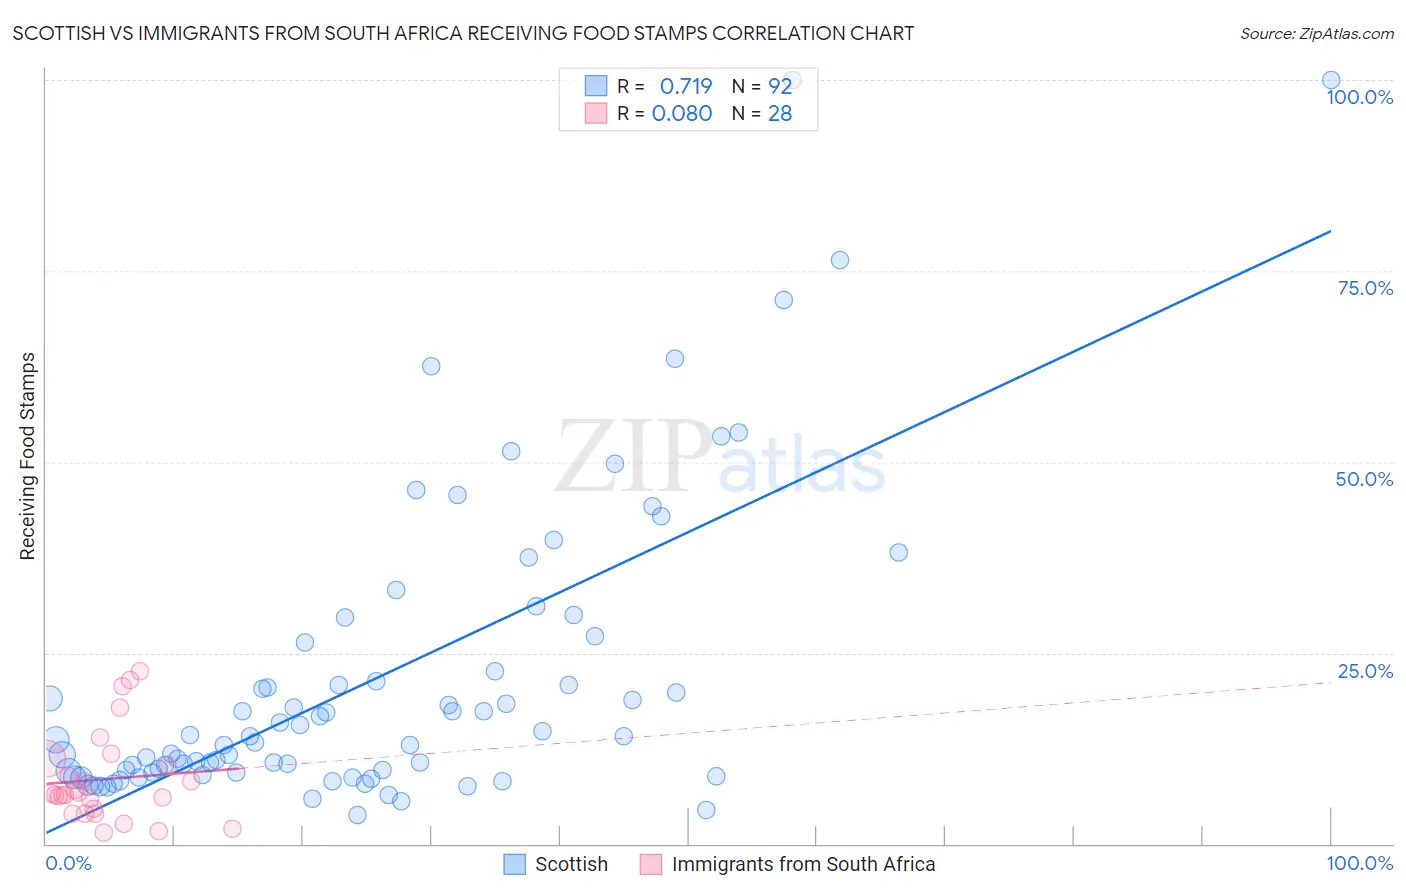
Scottish vs Immigrants from South Africa Receiving Food Stamps Correlation Chart
The statistical analysis conducted on geographies consisting of 563,544,150 people shows a strong positive correlation between the proportion of Scottish and percentage of population receiving government assistance and/or food stamps in the United States with a correlation coefficient (R) of 0.719 and weighted average of 9.9%. Similarly, the statistical analysis conducted on geographies consisting of 232,853,453 people shows a slight positive correlation between the proportion of Immigrants from South Africa and percentage of population receiving government assistance and/or food stamps in the United States with a correlation coefficient (R) of 0.080 and weighted average of 9.7%, a difference of 1.9%.
Receiving Food Stamps Correlation Summary
| Measurement | Scottish | Immigrants from South Africa |
| Minimum | 3.7% | 1.5% |
| Maximum | 100.0% | 22.6% |
| Range | 96.3% | 21.1% |
| Mean | 21.7% | 8.5% |
| Median | 13.8% | 6.5% |
| Interquartile 25% (IQ1) | 9.4% | 4.3% |
| Interquartile 75% (IQ3) | 24.5% | 10.7% |
| Interquartile Range (IQR) | 15.1% | 6.4% |
| Standard Deviation (Sample) | 19.9% | 5.9% |
| Standard Deviation (Population) | 19.8% | 5.8% |
Demographics Similar to Scottish and Immigrants from South Africa by Receiving Food Stamps
In terms of receiving food stamps, the demographic groups most similar to Scottish are Immigrants from Serbia (9.9%, a difference of 0.13%), Italian (9.9%, a difference of 0.18%), Northern European (9.8%, a difference of 0.39%), Immigrants from Indonesia (9.8%, a difference of 0.45%), and Slovene (9.8%, a difference of 0.61%). Similarly, the demographic groups most similar to Immigrants from South Africa are Asian (9.7%, a difference of 0.010%), Tongan (9.7%, a difference of 0.010%), Swiss (9.7%, a difference of 0.13%), Immigrants from Switzerland (9.7%, a difference of 0.14%), and Immigrants from Canada (9.7%, a difference of 0.33%).
| Demographics | Rating | Rank | Receiving Food Stamps |
| Asians | 99.3 /100 | #51 | Exceptional 9.7% |
| Immigrants | South Africa | 99.3 /100 | #52 | Exceptional 9.7% |
| Tongans | 99.3 /100 | #53 | Exceptional 9.7% |
| Swiss | 99.3 /100 | #54 | Exceptional 9.7% |
| Immigrants | Switzerland | 99.3 /100 | #55 | Exceptional 9.7% |
| Immigrants | Canada | 99.3 /100 | #56 | Exceptional 9.7% |
| Greeks | 99.3 /100 | #57 | Exceptional 9.7% |
| Scandinavians | 99.2 /100 | #58 | Exceptional 9.7% |
| British | 99.2 /100 | #59 | Exceptional 9.7% |
| Germans | 99.2 /100 | #60 | Exceptional 9.7% |
| English | 99.2 /100 | #61 | Exceptional 9.8% |
| Immigrants | Bulgaria | 99.2 /100 | #62 | Exceptional 9.8% |
| Chinese | 99.2 /100 | #63 | Exceptional 9.8% |
| Immigrants | North America | 99.2 /100 | #64 | Exceptional 9.8% |
| Immigrants | Turkey | 99.1 /100 | #65 | Exceptional 9.8% |
| Slovenes | 99.1 /100 | #66 | Exceptional 9.8% |
| Immigrants | Indonesia | 99.0 /100 | #67 | Exceptional 9.8% |
| Northern Europeans | 99.0 /100 | #68 | Exceptional 9.8% |
| Italians | 99.0 /100 | #69 | Exceptional 9.9% |
| Immigrants | Serbia | 99.0 /100 | #70 | Exceptional 9.9% |
| Scottish | 98.9 /100 | #71 | Exceptional 9.9% |