Irish vs Immigrants from Lithuania Receiving Food Stamps
COMPARE
Irish
Immigrants from Lithuania
Receiving Food Stamps
Receiving Food Stamps Comparison
Irish
Immigrants from Lithuania
10.2%
RECEIVING FOOD STAMPS
97.9/ 100
METRIC RATING
92nd/ 347
METRIC RANK
9.2%
RECEIVING FOOD STAMPS
99.8/ 100
METRIC RATING
29th/ 347
METRIC RANK
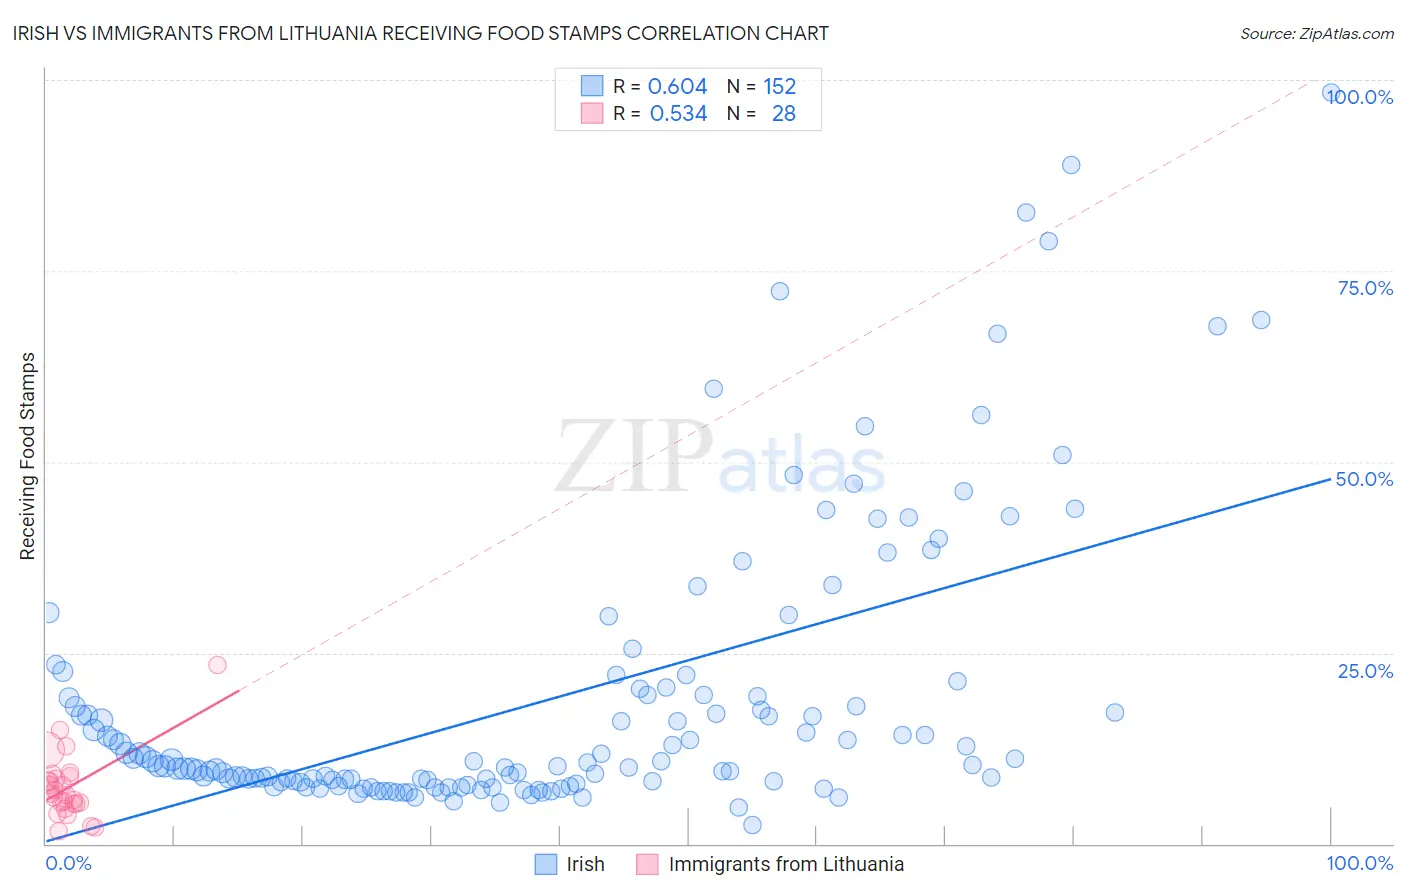
Irish vs Immigrants from Lithuania Receiving Food Stamps Correlation Chart
The statistical analysis conducted on geographies consisting of 576,263,816 people shows a significant positive correlation between the proportion of Irish and percentage of population receiving government assistance and/or food stamps in the United States with a correlation coefficient (R) of 0.604 and weighted average of 10.2%. Similarly, the statistical analysis conducted on geographies consisting of 117,609,856 people shows a substantial positive correlation between the proportion of Immigrants from Lithuania and percentage of population receiving government assistance and/or food stamps in the United States with a correlation coefficient (R) of 0.534 and weighted average of 9.2%, a difference of 9.9%.
Receiving Food Stamps Correlation Summary
| Measurement | Irish | Immigrants from Lithuania |
| Minimum | 2.5% | 1.6% |
| Maximum | 98.4% | 23.4% |
| Range | 95.9% | 21.8% |
| Mean | 18.8% | 7.4% |
| Median | 10.3% | 6.4% |
| Interquartile 25% (IQ1) | 8.1% | 5.2% |
| Interquartile 75% (IQ3) | 19.4% | 8.6% |
| Interquartile Range (IQR) | 11.3% | 3.4% |
| Standard Deviation (Sample) | 18.6% | 4.4% |
| Standard Deviation (Population) | 18.6% | 4.3% |
Similar Demographics by Receiving Food Stamps
Demographics Similar to Irish by Receiving Food Stamps
In terms of receiving food stamps, the demographic groups most similar to Irish are Jordanian (10.2%, a difference of 0.0%), Finnish (10.2%, a difference of 0.040%), Belgian (10.2%, a difference of 0.38%), Immigrants from France (10.1%, a difference of 0.89%), and Immigrants from Greece (10.3%, a difference of 0.91%).
| Demographics | Rating | Rank | Receiving Food Stamps |
| Immigrants | Romania | 98.5 /100 | #85 | Exceptional 10.0% |
| Immigrants | Norway | 98.4 /100 | #86 | Exceptional 10.0% |
| Egyptians | 98.4 /100 | #87 | Exceptional 10.0% |
| Immigrants | Kuwait | 98.4 /100 | #88 | Exceptional 10.0% |
| Immigrants | France | 98.3 /100 | #89 | Exceptional 10.1% |
| Finns | 97.9 /100 | #90 | Exceptional 10.2% |
| Jordanians | 97.9 /100 | #91 | Exceptional 10.2% |
| Irish | 97.9 /100 | #92 | Exceptional 10.2% |
| Belgians | 97.7 /100 | #93 | Exceptional 10.2% |
| Immigrants | Greece | 97.4 /100 | #94 | Exceptional 10.3% |
| Basques | 97.4 /100 | #95 | Exceptional 10.3% |
| Welsh | 97.3 /100 | #96 | Exceptional 10.3% |
| Czechoslovakians | 97.2 /100 | #97 | Exceptional 10.3% |
| Immigrants | Egypt | 97.1 /100 | #98 | Exceptional 10.3% |
| Serbians | 97.0 /100 | #99 | Exceptional 10.3% |
Demographics Similar to Immigrants from Lithuania by Receiving Food Stamps
In terms of receiving food stamps, the demographic groups most similar to Immigrants from Lithuania are Czech (9.2%, a difference of 0.27%), Bhutanese (9.2%, a difference of 0.28%), Immigrants from Sweden (9.3%, a difference of 0.37%), Swedish (9.2%, a difference of 0.52%), and Immigrants from Ireland (9.2%, a difference of 0.72%).
| Demographics | Rating | Rank | Receiving Food Stamps |
| Immigrants | Australia | 99.8 /100 | #22 | Exceptional 9.2% |
| Eastern Europeans | 99.8 /100 | #23 | Exceptional 9.2% |
| Immigrants | Northern Europe | 99.8 /100 | #24 | Exceptional 9.2% |
| Immigrants | Ireland | 99.8 /100 | #25 | Exceptional 9.2% |
| Swedes | 99.8 /100 | #26 | Exceptional 9.2% |
| Bhutanese | 99.8 /100 | #27 | Exceptional 9.2% |
| Czechs | 99.8 /100 | #28 | Exceptional 9.2% |
| Immigrants | Lithuania | 99.8 /100 | #29 | Exceptional 9.2% |
| Immigrants | Sweden | 99.7 /100 | #30 | Exceptional 9.3% |
| Immigrants | Eastern Asia | 99.7 /100 | #31 | Exceptional 9.3% |
| Bolivians | 99.7 /100 | #32 | Exceptional 9.3% |
| Zimbabweans | 99.6 /100 | #33 | Exceptional 9.5% |
| Turks | 99.6 /100 | #34 | Exceptional 9.5% |
| Immigrants | Austria | 99.6 /100 | #35 | Exceptional 9.5% |
| Estonians | 99.6 /100 | #36 | Exceptional 9.5% |