Scottish vs Iroquois Receiving Food Stamps
COMPARE
Scottish
Iroquois
Receiving Food Stamps
Receiving Food Stamps Comparison
Scottish
Iroquois
9.9%
RECEIVING FOOD STAMPS
98.9/ 100
METRIC RATING
71st/ 347
METRIC RANK
13.5%
RECEIVING FOOD STAMPS
1.2/ 100
METRIC RATING
240th/ 347
METRIC RANK
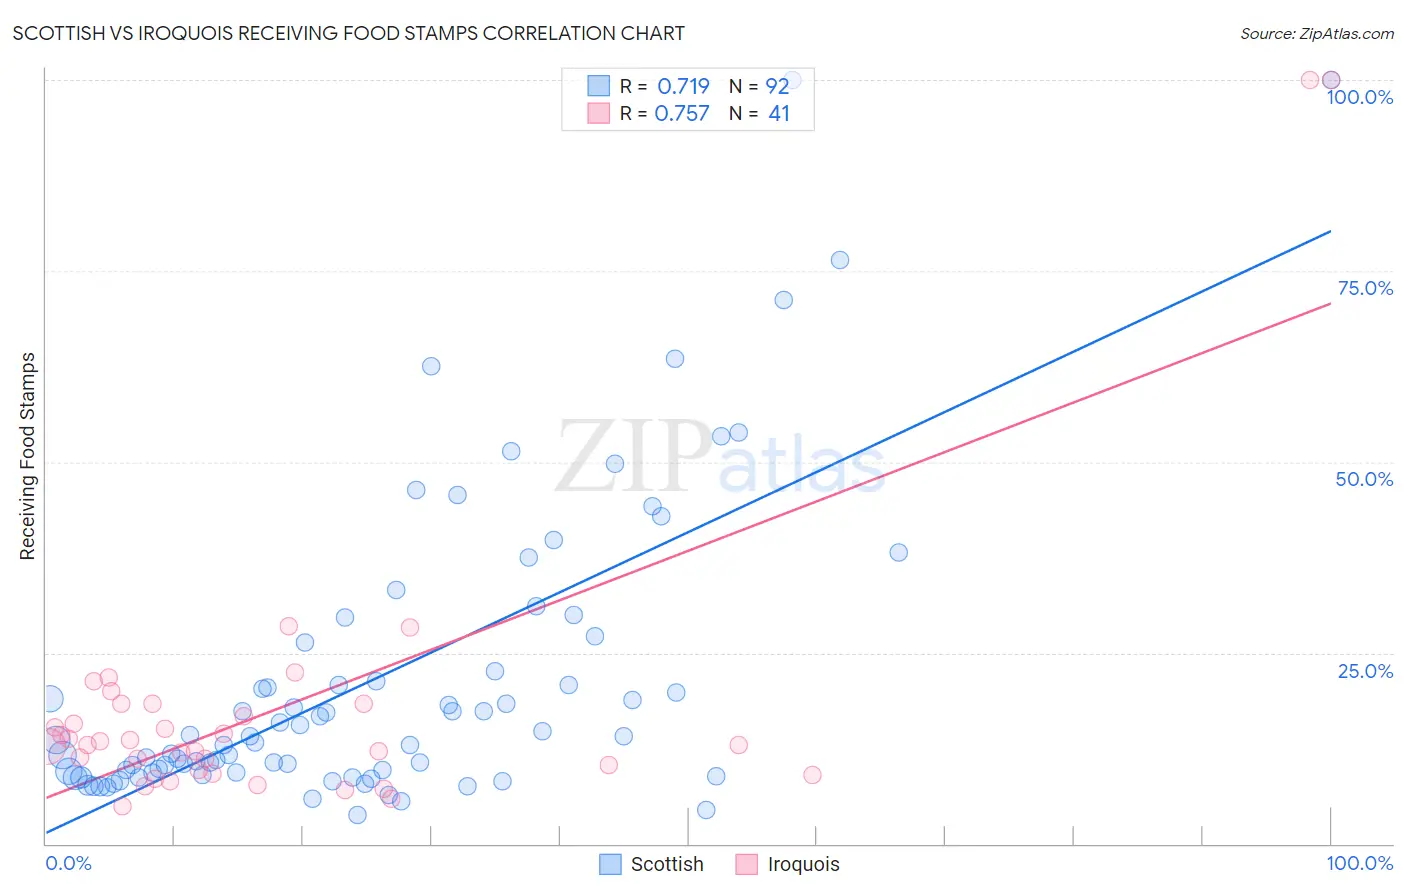
Scottish vs Iroquois Receiving Food Stamps Correlation Chart
The statistical analysis conducted on geographies consisting of 563,544,150 people shows a strong positive correlation between the proportion of Scottish and percentage of population receiving government assistance and/or food stamps in the United States with a correlation coefficient (R) of 0.719 and weighted average of 9.9%. Similarly, the statistical analysis conducted on geographies consisting of 207,071,964 people shows a strong positive correlation between the proportion of Iroquois and percentage of population receiving government assistance and/or food stamps in the United States with a correlation coefficient (R) of 0.757 and weighted average of 13.5%, a difference of 37.2%.
Receiving Food Stamps Correlation Summary
| Measurement | Scottish | Iroquois |
| Minimum | 3.7% | 4.9% |
| Maximum | 100.0% | 100.0% |
| Range | 96.3% | 95.1% |
| Mean | 21.7% | 17.9% |
| Median | 13.8% | 13.0% |
| Interquartile 25% (IQ1) | 9.4% | 9.5% |
| Interquartile 75% (IQ3) | 24.5% | 18.4% |
| Interquartile Range (IQR) | 15.1% | 8.9% |
| Standard Deviation (Sample) | 19.9% | 19.6% |
| Standard Deviation (Population) | 19.8% | 19.4% |
Similar Demographics by Receiving Food Stamps
Demographics Similar to Scottish by Receiving Food Stamps
In terms of receiving food stamps, the demographic groups most similar to Scottish are Immigrants from Serbia (9.9%, a difference of 0.13%), Italian (9.9%, a difference of 0.18%), Immigrants from Asia (9.9%, a difference of 0.24%), Macedonian (9.9%, a difference of 0.30%), and Northern European (9.8%, a difference of 0.39%).
| Demographics | Rating | Rank | Receiving Food Stamps |
| Immigrants | North America | 99.2 /100 | #64 | Exceptional 9.8% |
| Immigrants | Turkey | 99.1 /100 | #65 | Exceptional 9.8% |
| Slovenes | 99.1 /100 | #66 | Exceptional 9.8% |
| Immigrants | Indonesia | 99.0 /100 | #67 | Exceptional 9.8% |
| Northern Europeans | 99.0 /100 | #68 | Exceptional 9.8% |
| Italians | 99.0 /100 | #69 | Exceptional 9.9% |
| Immigrants | Serbia | 99.0 /100 | #70 | Exceptional 9.9% |
| Scottish | 98.9 /100 | #71 | Exceptional 9.9% |
| Immigrants | Asia | 98.9 /100 | #72 | Exceptional 9.9% |
| Macedonians | 98.9 /100 | #73 | Exceptional 9.9% |
| New Zealanders | 98.8 /100 | #74 | Exceptional 9.9% |
| Immigrants | Zimbabwe | 98.7 /100 | #75 | Exceptional 9.9% |
| Immigrants | Croatia | 98.7 /100 | #76 | Exceptional 10.0% |
| Immigrants | North Macedonia | 98.7 /100 | #77 | Exceptional 10.0% |
| South Africans | 98.7 /100 | #78 | Exceptional 10.0% |
Demographics Similar to Iroquois by Receiving Food Stamps
In terms of receiving food stamps, the demographic groups most similar to Iroquois are Immigrants from Micronesia (13.5%, a difference of 0.30%), Choctaw (13.6%, a difference of 0.43%), French American Indian (13.5%, a difference of 0.53%), Immigrants from Panama (13.6%, a difference of 0.62%), and Immigrants from El Salvador (13.5%, a difference of 0.72%).
| Demographics | Rating | Rank | Receiving Food Stamps |
| Cherokee | 2.5 /100 | #233 | Tragic 13.2% |
| Comanche | 2.4 /100 | #234 | Tragic 13.3% |
| Immigrants | Zaire | 1.9 /100 | #235 | Tragic 13.4% |
| Crow | 1.6 /100 | #236 | Tragic 13.4% |
| Immigrants | El Salvador | 1.5 /100 | #237 | Tragic 13.5% |
| French American Indians | 1.4 /100 | #238 | Tragic 13.5% |
| Immigrants | Micronesia | 1.3 /100 | #239 | Tragic 13.5% |
| Iroquois | 1.2 /100 | #240 | Tragic 13.5% |
| Choctaw | 1.0 /100 | #241 | Tragic 13.6% |
| Immigrants | Panama | 1.0 /100 | #242 | Tragic 13.6% |
| Somalis | 0.9 /100 | #243 | Tragic 13.7% |
| Cajuns | 0.9 /100 | #244 | Tragic 13.7% |
| Immigrants | Somalia | 0.9 /100 | #245 | Tragic 13.7% |
| Cree | 0.8 /100 | #246 | Tragic 13.7% |
| Mexican American Indians | 0.7 /100 | #247 | Tragic 13.8% |