Samoan vs Iranian Single Male Poverty
COMPARE
Samoan
Iranian
Single Male Poverty
Single Male Poverty Comparison
Samoans
Iranians
11.7%
SINGLE MALE POVERTY
99.9/ 100
METRIC RATING
52nd/ 347
METRIC RANK
11.4%
SINGLE MALE POVERTY
100.0/ 100
METRIC RATING
30th/ 347
METRIC RANK
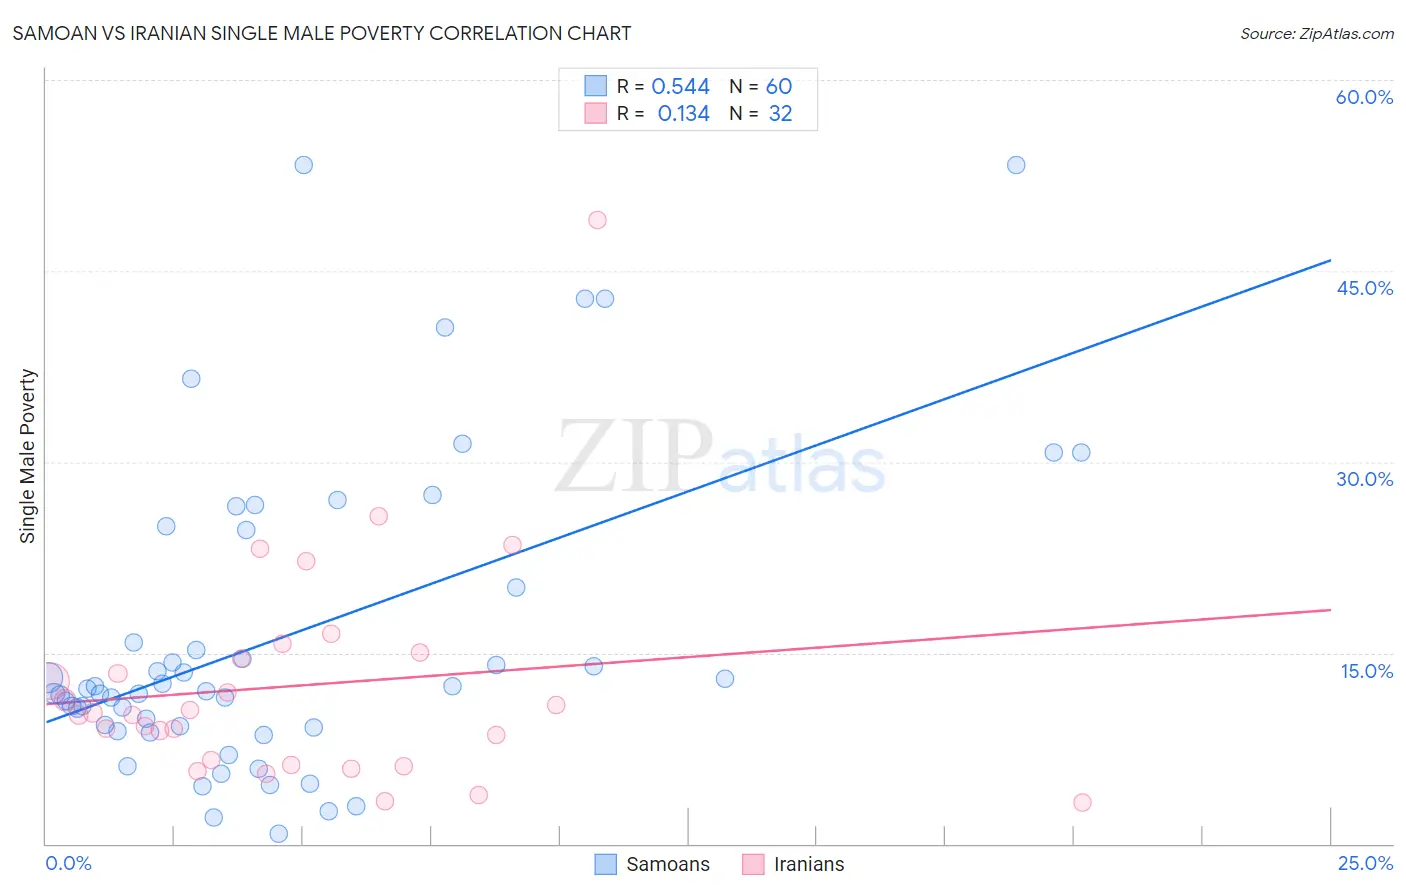
Samoan vs Iranian Single Male Poverty Correlation Chart
The statistical analysis conducted on geographies consisting of 211,659,255 people shows a substantial positive correlation between the proportion of Samoans and poverty level among single males in the United States with a correlation coefficient (R) of 0.544 and weighted average of 11.7%. Similarly, the statistical analysis conducted on geographies consisting of 284,868,463 people shows a poor positive correlation between the proportion of Iranians and poverty level among single males in the United States with a correlation coefficient (R) of 0.134 and weighted average of 11.4%, a difference of 2.2%.
Single Male Poverty Correlation Summary
| Measurement | Samoan | Iranian |
| Minimum | 0.75% | 3.2% |
| Maximum | 53.3% | 49.0% |
| Range | 52.6% | 45.8% |
| Mean | 16.3% | 12.4% |
| Median | 12.1% | 10.2% |
| Interquartile 25% (IQ1) | 9.2% | 6.4% |
| Interquartile 75% (IQ3) | 22.4% | 14.8% |
| Interquartile Range (IQR) | 13.2% | 8.4% |
| Standard Deviation (Sample) | 12.2% | 8.9% |
| Standard Deviation (Population) | 12.1% | 8.8% |
Similar Demographics by Single Male Poverty
Demographics Similar to Samoans by Single Male Poverty
In terms of single male poverty, the demographic groups most similar to Samoans are Bulgarian (11.7%, a difference of 0.10%), Immigrants from Uzbekistan (11.7%, a difference of 0.12%), Cypriot (11.7%, a difference of 0.29%), Paraguayan (11.6%, a difference of 0.31%), and Immigrants from Lithuania (11.6%, a difference of 0.42%).
| Demographics | Rating | Rank | Single Male Poverty |
| Immigrants | Poland | 99.9 /100 | #45 | Exceptional 11.5% |
| Immigrants | Bulgaria | 99.9 /100 | #46 | Exceptional 11.6% |
| Nepalese | 99.9 /100 | #47 | Exceptional 11.6% |
| Immigrants | Indonesia | 99.9 /100 | #48 | Exceptional 11.6% |
| Tlingit-Haida | 99.9 /100 | #49 | Exceptional 11.6% |
| Immigrants | Lithuania | 99.9 /100 | #50 | Exceptional 11.6% |
| Paraguayans | 99.9 /100 | #51 | Exceptional 11.6% |
| Samoans | 99.9 /100 | #52 | Exceptional 11.7% |
| Bulgarians | 99.9 /100 | #53 | Exceptional 11.7% |
| Immigrants | Uzbekistan | 99.9 /100 | #54 | Exceptional 11.7% |
| Cypriots | 99.9 /100 | #55 | Exceptional 11.7% |
| Burmese | 99.8 /100 | #56 | Exceptional 11.7% |
| Immigrants | Romania | 99.8 /100 | #57 | Exceptional 11.7% |
| Immigrants | Brazil | 99.8 /100 | #58 | Exceptional 11.7% |
| Brazilians | 99.8 /100 | #59 | Exceptional 11.8% |
Demographics Similar to Iranians by Single Male Poverty
In terms of single male poverty, the demographic groups most similar to Iranians are Immigrants from Egypt (11.4%, a difference of 0.060%), Immigrants from Iran (11.4%, a difference of 0.090%), Immigrants from Asia (11.4%, a difference of 0.16%), Immigrants from Eastern Asia (11.4%, a difference of 0.18%), and Immigrants from China (11.4%, a difference of 0.23%).
| Demographics | Rating | Rank | Single Male Poverty |
| Bolivians | 100.0 /100 | #23 | Exceptional 11.2% |
| Indians (Asian) | 100.0 /100 | #24 | Exceptional 11.3% |
| Maltese | 100.0 /100 | #25 | Exceptional 11.3% |
| Immigrants | Japan | 100.0 /100 | #26 | Exceptional 11.3% |
| Immigrants | China | 100.0 /100 | #27 | Exceptional 11.4% |
| Immigrants | Asia | 100.0 /100 | #28 | Exceptional 11.4% |
| Immigrants | Egypt | 100.0 /100 | #29 | Exceptional 11.4% |
| Iranians | 100.0 /100 | #30 | Exceptional 11.4% |
| Immigrants | Iran | 100.0 /100 | #31 | Exceptional 11.4% |
| Immigrants | Eastern Asia | 100.0 /100 | #32 | Exceptional 11.4% |
| Immigrants | Vietnam | 100.0 /100 | #33 | Exceptional 11.4% |
| Immigrants | Ethiopia | 100.0 /100 | #34 | Exceptional 11.4% |
| Immigrants | South Eastern Asia | 100.0 /100 | #35 | Exceptional 11.4% |
| Immigrants | Serbia | 100.0 /100 | #36 | Exceptional 11.4% |
| Immigrants | Singapore | 100.0 /100 | #37 | Exceptional 11.4% |