Immigrants from Eastern Europe vs Immigrants from Panama Child Poverty Under the Age of 5
COMPARE
Immigrants from Eastern Europe
Immigrants from Panama
Child Poverty Under the Age of 5
Child Poverty Under the Age of 5 Comparison
Immigrants from Eastern Europe
Immigrants from Panama
15.1%
CHILD POVERTY UNDER THE AGE OF 5
99.1/ 100
METRIC RATING
62nd/ 347
METRIC RANK
18.5%
CHILD POVERTY UNDER THE AGE OF 5
6.0/ 100
METRIC RATING
215th/ 347
METRIC RANK
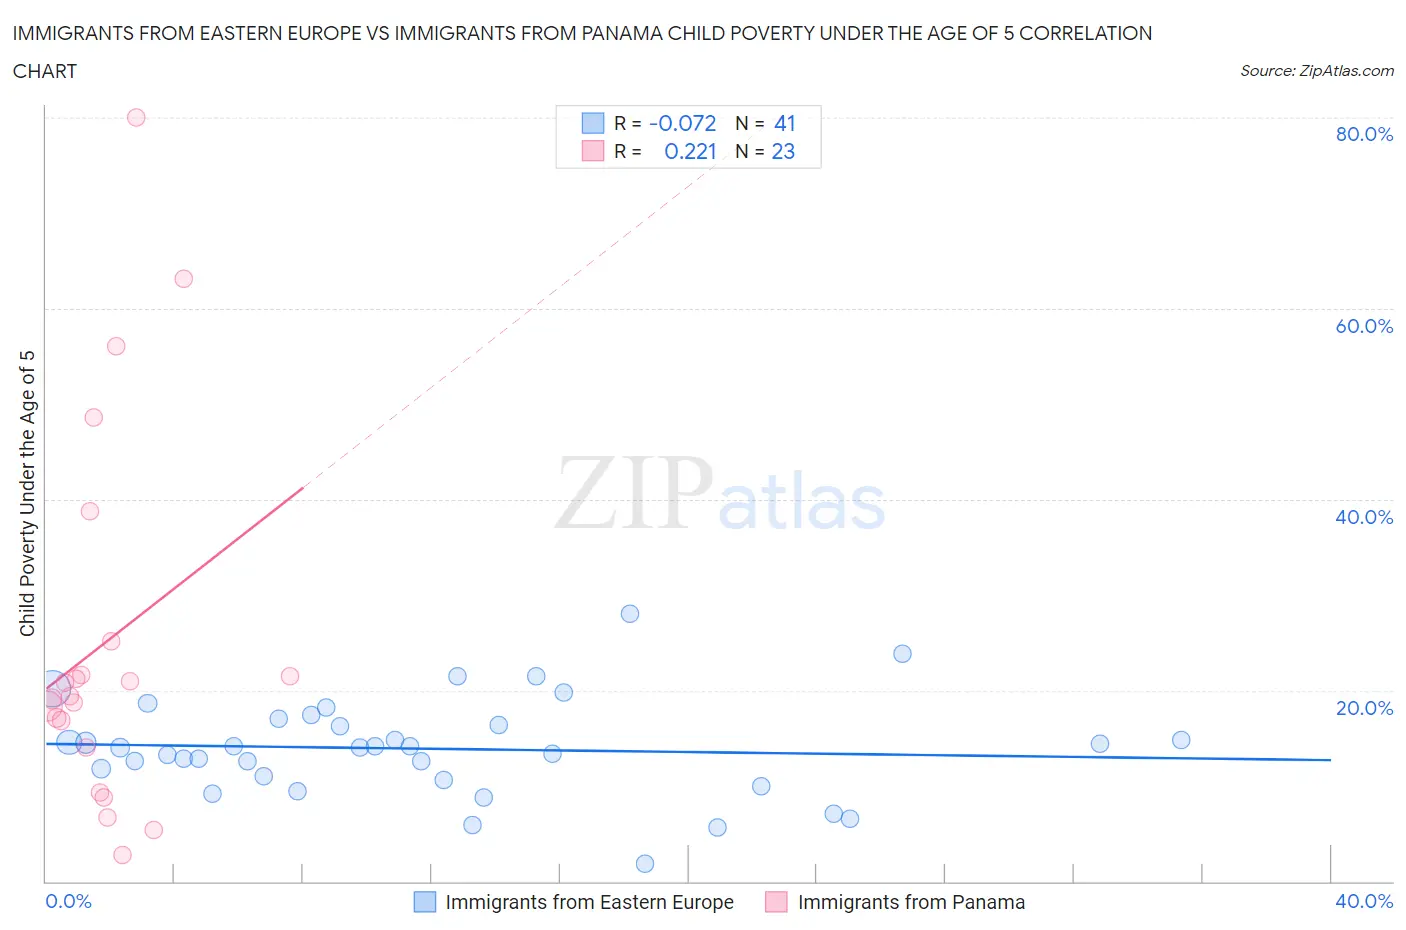
Immigrants from Eastern Europe vs Immigrants from Panama Child Poverty Under the Age of 5 Correlation Chart
The statistical analysis conducted on geographies consisting of 448,928,645 people shows a slight negative correlation between the proportion of Immigrants from Eastern Europe and poverty level among children under the age of 5 in the United States with a correlation coefficient (R) of -0.072 and weighted average of 15.1%. Similarly, the statistical analysis conducted on geographies consisting of 217,169,883 people shows a weak positive correlation between the proportion of Immigrants from Panama and poverty level among children under the age of 5 in the United States with a correlation coefficient (R) of 0.221 and weighted average of 18.5%, a difference of 22.0%.
Child Poverty Under the Age of 5 Correlation Summary
| Measurement | Immigrants from Eastern Europe | Immigrants from Panama |
| Minimum | 1.8% | 2.7% |
| Maximum | 28.1% | 80.0% |
| Range | 26.2% | 77.3% |
| Mean | 13.9% | 25.0% |
| Median | 13.9% | 19.4% |
| Interquartile 25% (IQ1) | 10.8% | 14.0% |
| Interquartile 75% (IQ3) | 16.7% | 25.1% |
| Interquartile Range (IQR) | 5.9% | 11.1% |
| Standard Deviation (Sample) | 5.2% | 19.5% |
| Standard Deviation (Population) | 5.1% | 19.1% |
Similar Demographics by Child Poverty Under the Age of 5
Demographics Similar to Immigrants from Eastern Europe by Child Poverty Under the Age of 5
In terms of child poverty under the age of 5, the demographic groups most similar to Immigrants from Eastern Europe are Immigrants from Poland (15.1%, a difference of 0.12%), Immigrants from Europe (15.1%, a difference of 0.13%), Immigrants from Romania (15.2%, a difference of 0.15%), Immigrants from Fiji (15.2%, a difference of 0.18%), and Immigrants from Scotland (15.2%, a difference of 0.29%).
| Demographics | Rating | Rank | Child Poverty Under the Age of 5 |
| Danes | 99.4 /100 | #55 | Exceptional 14.9% |
| Immigrants | Pakistan | 99.4 /100 | #56 | Exceptional 14.9% |
| Egyptians | 99.4 /100 | #57 | Exceptional 14.9% |
| Swedes | 99.4 /100 | #58 | Exceptional 15.0% |
| Paraguayans | 99.4 /100 | #59 | Exceptional 15.0% |
| Immigrants | Russia | 99.3 /100 | #60 | Exceptional 15.0% |
| Immigrants | Poland | 99.1 /100 | #61 | Exceptional 15.1% |
| Immigrants | Eastern Europe | 99.1 /100 | #62 | Exceptional 15.1% |
| Immigrants | Europe | 99.1 /100 | #63 | Exceptional 15.1% |
| Immigrants | Romania | 99.1 /100 | #64 | Exceptional 15.2% |
| Immigrants | Fiji | 99.0 /100 | #65 | Exceptional 15.2% |
| Immigrants | Scotland | 99.0 /100 | #66 | Exceptional 15.2% |
| Greeks | 99.0 /100 | #67 | Exceptional 15.2% |
| Zimbabweans | 99.0 /100 | #68 | Exceptional 15.2% |
| Lithuanians | 99.0 /100 | #69 | Exceptional 15.2% |
Demographics Similar to Immigrants from Panama by Child Poverty Under the Age of 5
In terms of child poverty under the age of 5, the demographic groups most similar to Immigrants from Panama are Malaysian (18.4%, a difference of 0.20%), Hmong (18.5%, a difference of 0.46%), Immigrants from Africa (18.6%, a difference of 0.66%), Immigrants from Thailand (18.3%, a difference of 0.97%), and Nepalese (18.3%, a difference of 0.99%).
| Demographics | Rating | Rank | Child Poverty Under the Age of 5 |
| Scotch-Irish | 9.8 /100 | #208 | Tragic 18.2% |
| Spanish | 9.8 /100 | #209 | Tragic 18.2% |
| Panamanians | 9.7 /100 | #210 | Tragic 18.2% |
| Moroccans | 9.4 /100 | #211 | Tragic 18.2% |
| Nepalese | 8.7 /100 | #212 | Tragic 18.3% |
| Immigrants | Thailand | 8.6 /100 | #213 | Tragic 18.3% |
| Malaysians | 6.5 /100 | #214 | Tragic 18.4% |
| Immigrants | Panama | 6.0 /100 | #215 | Tragic 18.5% |
| Hmong | 5.0 /100 | #216 | Tragic 18.5% |
| Immigrants | Africa | 4.6 /100 | #217 | Tragic 18.6% |
| Delaware | 3.4 /100 | #218 | Tragic 18.7% |
| German Russians | 3.0 /100 | #219 | Tragic 18.8% |
| Immigrants | Azores | 2.6 /100 | #220 | Tragic 18.9% |
| Immigrants | Nigeria | 2.1 /100 | #221 | Tragic 19.0% |
| Alsatians | 1.7 /100 | #222 | Tragic 19.1% |