Scandinavian vs Immigrants from Panama In Labor Force | Age 35-44
COMPARE
Scandinavian
Immigrants from Panama
In Labor Force | Age 35-44
In Labor Force | Age 35-44 Comparison
Scandinavians
Immigrants from Panama
84.4%
IN LABOR FORCE | AGE 35-44
51.2/ 100
METRIC RATING
172nd/ 347
METRIC RANK
84.0%
IN LABOR FORCE | AGE 35-44
6.4/ 100
METRIC RATING
223rd/ 347
METRIC RANK
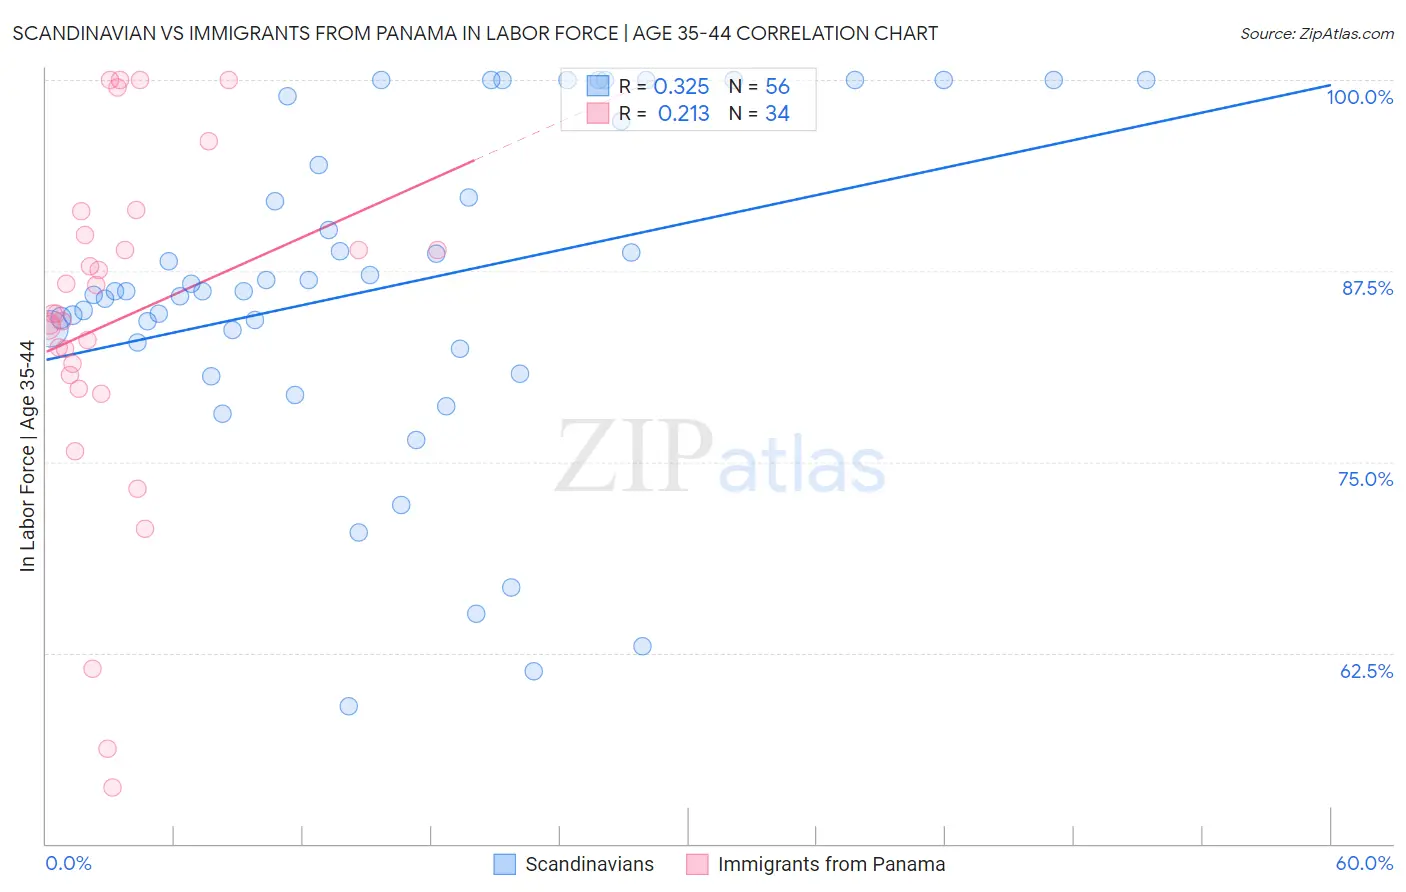
Scandinavian vs Immigrants from Panama In Labor Force | Age 35-44 Correlation Chart
The statistical analysis conducted on geographies consisting of 472,338,755 people shows a mild positive correlation between the proportion of Scandinavians and labor force participation rate among population between the ages 35 and 44 in the United States with a correlation coefficient (R) of 0.325 and weighted average of 84.4%. Similarly, the statistical analysis conducted on geographies consisting of 221,162,484 people shows a weak positive correlation between the proportion of Immigrants from Panama and labor force participation rate among population between the ages 35 and 44 in the United States with a correlation coefficient (R) of 0.213 and weighted average of 84.0%, a difference of 0.44%.
In Labor Force | Age 35-44 Correlation Summary
| Measurement | Scandinavian | Immigrants from Panama |
| Minimum | 59.0% | 53.7% |
| Maximum | 100.0% | 100.0% |
| Range | 41.0% | 46.3% |
| Mean | 86.4% | 84.3% |
| Median | 86.2% | 84.7% |
| Interquartile 25% (IQ1) | 82.6% | 80.7% |
| Interquartile 75% (IQ3) | 95.9% | 89.8% |
| Interquartile Range (IQR) | 13.2% | 9.2% |
| Standard Deviation (Sample) | 10.7% | 11.4% |
| Standard Deviation (Population) | 10.6% | 11.2% |
Similar Demographics by In Labor Force | Age 35-44
Demographics Similar to Scandinavians by In Labor Force | Age 35-44
In terms of in labor force | age 35-44, the demographic groups most similar to Scandinavians are Jordanian (84.4%, a difference of 0.0%), Immigrants from Trinidad and Tobago (84.4%, a difference of 0.0%), Irish (84.4%, a difference of 0.010%), Immigrants from Afghanistan (84.4%, a difference of 0.010%), and Immigrants from Jordan (84.4%, a difference of 0.010%).
| Demographics | Rating | Rank | In Labor Force | Age 35-44 |
| Venezuelans | 58.1 /100 | #165 | Average 84.4% |
| Alsatians | 55.2 /100 | #166 | Average 84.4% |
| Immigrants | Portugal | 55.2 /100 | #167 | Average 84.4% |
| Irish | 53.1 /100 | #168 | Average 84.4% |
| Immigrants | Afghanistan | 52.7 /100 | #169 | Average 84.4% |
| Immigrants | Jordan | 52.5 /100 | #170 | Average 84.4% |
| Jordanians | 51.7 /100 | #171 | Average 84.4% |
| Scandinavians | 51.2 /100 | #172 | Average 84.4% |
| Immigrants | Trinidad and Tobago | 50.7 /100 | #173 | Average 84.4% |
| Immigrants | Iran | 50.0 /100 | #174 | Average 84.4% |
| Pakistanis | 48.2 /100 | #175 | Average 84.4% |
| Sri Lankans | 47.3 /100 | #176 | Average 84.4% |
| French Canadians | 44.3 /100 | #177 | Average 84.3% |
| Northern Europeans | 44.1 /100 | #178 | Average 84.3% |
| Immigrants | South Africa | 42.8 /100 | #179 | Average 84.3% |
Demographics Similar to Immigrants from Panama by In Labor Force | Age 35-44
In terms of in labor force | age 35-44, the demographic groups most similar to Immigrants from Panama are Assyrian/Chaldean/Syriac (84.0%, a difference of 0.0%), Icelander (84.0%, a difference of 0.010%), U.S. Virgin Islander (84.0%, a difference of 0.010%), Immigrants from Burma/Myanmar (84.0%, a difference of 0.010%), and French (84.0%, a difference of 0.030%).
| Demographics | Rating | Rank | In Labor Force | Age 35-44 |
| Nicaraguans | 12.1 /100 | #216 | Poor 84.1% |
| Immigrants | Norway | 11.7 /100 | #217 | Poor 84.1% |
| Immigrants | Nicaragua | 9.4 /100 | #218 | Tragic 84.1% |
| Sub-Saharan Africans | 9.3 /100 | #219 | Tragic 84.1% |
| French | 7.5 /100 | #220 | Tragic 84.0% |
| Icelanders | 6.7 /100 | #221 | Tragic 84.0% |
| Assyrians/Chaldeans/Syriacs | 6.6 /100 | #222 | Tragic 84.0% |
| Immigrants | Panama | 6.4 /100 | #223 | Tragic 84.0% |
| U.S. Virgin Islanders | 6.1 /100 | #224 | Tragic 84.0% |
| Immigrants | Burma/Myanmar | 6.1 /100 | #225 | Tragic 84.0% |
| Panamanians | 5.4 /100 | #226 | Tragic 84.0% |
| British West Indians | 5.3 /100 | #227 | Tragic 84.0% |
| Welsh | 5.3 /100 | #228 | Tragic 84.0% |
| Immigrants | Thailand | 4.7 /100 | #229 | Tragic 84.0% |
| Immigrants | Iraq | 3.7 /100 | #230 | Tragic 83.9% |