Paiute vs Immigrants from Panama Child Poverty Under the Age of 5
COMPARE
Paiute
Immigrants from Panama
Child Poverty Under the Age of 5
Child Poverty Under the Age of 5 Comparison
Paiute
Immigrants from Panama
23.8%
CHILD POVERTY UNDER THE AGE OF 5
0.0/ 100
METRIC RATING
324th/ 347
METRIC RANK
18.5%
CHILD POVERTY UNDER THE AGE OF 5
6.0/ 100
METRIC RATING
215th/ 347
METRIC RANK
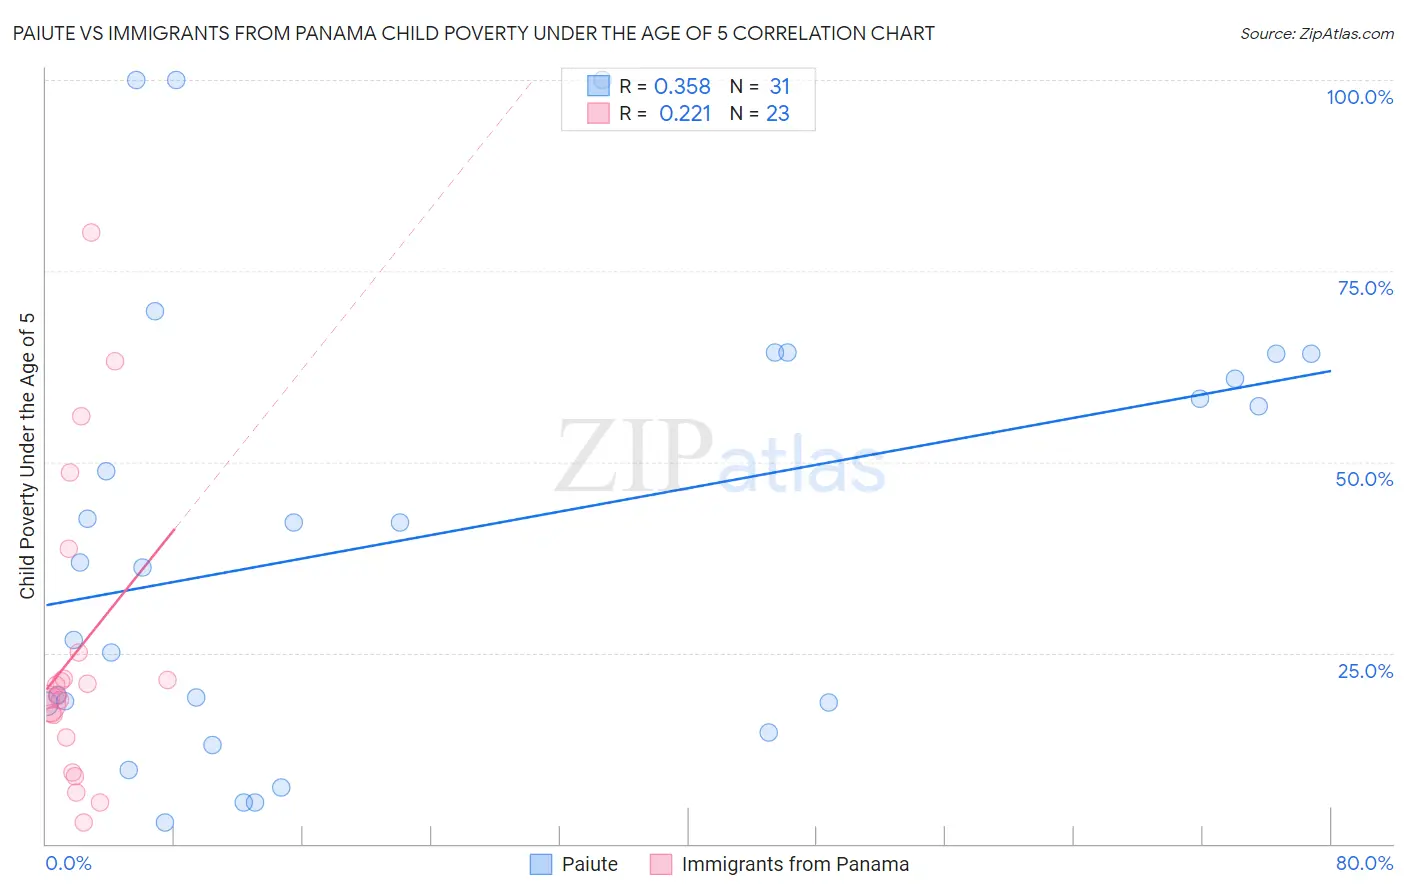
Paiute vs Immigrants from Panama Child Poverty Under the Age of 5 Correlation Chart
The statistical analysis conducted on geographies consisting of 58,012,157 people shows a mild positive correlation between the proportion of Paiute and poverty level among children under the age of 5 in the United States with a correlation coefficient (R) of 0.358 and weighted average of 23.8%. Similarly, the statistical analysis conducted on geographies consisting of 217,169,883 people shows a weak positive correlation between the proportion of Immigrants from Panama and poverty level among children under the age of 5 in the United States with a correlation coefficient (R) of 0.221 and weighted average of 18.5%, a difference of 29.1%.
Child Poverty Under the Age of 5 Correlation Summary
| Measurement | Paiute | Immigrants from Panama |
| Minimum | 2.7% | 2.7% |
| Maximum | 100.0% | 80.0% |
| Range | 97.3% | 77.3% |
| Mean | 40.5% | 25.0% |
| Median | 36.7% | 19.4% |
| Interquartile 25% (IQ1) | 18.4% | 14.0% |
| Interquartile 75% (IQ3) | 64.1% | 25.1% |
| Interquartile Range (IQR) | 45.7% | 11.1% |
| Standard Deviation (Sample) | 28.9% | 19.5% |
| Standard Deviation (Population) | 28.4% | 19.1% |
Similar Demographics by Child Poverty Under the Age of 5
Demographics Similar to Paiute by Child Poverty Under the Age of 5
In terms of child poverty under the age of 5, the demographic groups most similar to Paiute are Immigrants from Congo (23.9%, a difference of 0.21%), Central American Indian (23.9%, a difference of 0.39%), Pueblo (23.7%, a difference of 0.61%), Dominican (24.0%, a difference of 0.85%), and Immigrants from Dominican Republic (24.1%, a difference of 0.94%).
| Demographics | Rating | Rank | Child Poverty Under the Age of 5 |
| Menominee | 0.0 /100 | #317 | Tragic 23.3% |
| Dutch West Indians | 0.0 /100 | #318 | Tragic 23.3% |
| Chippewa | 0.0 /100 | #319 | Tragic 23.4% |
| Choctaw | 0.0 /100 | #320 | Tragic 23.5% |
| Immigrants | Honduras | 0.0 /100 | #321 | Tragic 23.5% |
| Ute | 0.0 /100 | #322 | Tragic 23.5% |
| Pueblo | 0.0 /100 | #323 | Tragic 23.7% |
| Paiute | 0.0 /100 | #324 | Tragic 23.8% |
| Immigrants | Congo | 0.0 /100 | #325 | Tragic 23.9% |
| Central American Indians | 0.0 /100 | #326 | Tragic 23.9% |
| Dominicans | 0.0 /100 | #327 | Tragic 24.0% |
| Immigrants | Dominican Republic | 0.0 /100 | #328 | Tragic 24.1% |
| Cajuns | 0.0 /100 | #329 | Tragic 24.1% |
| Creek | 0.0 /100 | #330 | Tragic 24.2% |
| Kiowa | 0.0 /100 | #331 | Tragic 24.5% |
Demographics Similar to Immigrants from Panama by Child Poverty Under the Age of 5
In terms of child poverty under the age of 5, the demographic groups most similar to Immigrants from Panama are Malaysian (18.4%, a difference of 0.20%), Hmong (18.5%, a difference of 0.46%), Immigrants from Africa (18.6%, a difference of 0.66%), Immigrants from Thailand (18.3%, a difference of 0.97%), and Nepalese (18.3%, a difference of 0.99%).
| Demographics | Rating | Rank | Child Poverty Under the Age of 5 |
| Scotch-Irish | 9.8 /100 | #208 | Tragic 18.2% |
| Spanish | 9.8 /100 | #209 | Tragic 18.2% |
| Panamanians | 9.7 /100 | #210 | Tragic 18.2% |
| Moroccans | 9.4 /100 | #211 | Tragic 18.2% |
| Nepalese | 8.7 /100 | #212 | Tragic 18.3% |
| Immigrants | Thailand | 8.6 /100 | #213 | Tragic 18.3% |
| Malaysians | 6.5 /100 | #214 | Tragic 18.4% |
| Immigrants | Panama | 6.0 /100 | #215 | Tragic 18.5% |
| Hmong | 5.0 /100 | #216 | Tragic 18.5% |
| Immigrants | Africa | 4.6 /100 | #217 | Tragic 18.6% |
| Delaware | 3.4 /100 | #218 | Tragic 18.7% |
| German Russians | 3.0 /100 | #219 | Tragic 18.8% |
| Immigrants | Azores | 2.6 /100 | #220 | Tragic 18.9% |
| Immigrants | Nigeria | 2.1 /100 | #221 | Tragic 19.0% |
| Alsatians | 1.7 /100 | #222 | Tragic 19.1% |