Scandinavian vs Cherokee Single Father Poverty
COMPARE
Scandinavian
Cherokee
Single Father Poverty
Single Father Poverty Comparison
Scandinavians
Cherokee
16.3%
SINGLE FATHER POVERTY
52.3/ 100
METRIC RATING
170th/ 347
METRIC RANK
19.6%
SINGLE FATHER POVERTY
0.0/ 100
METRIC RATING
321st/ 347
METRIC RANK
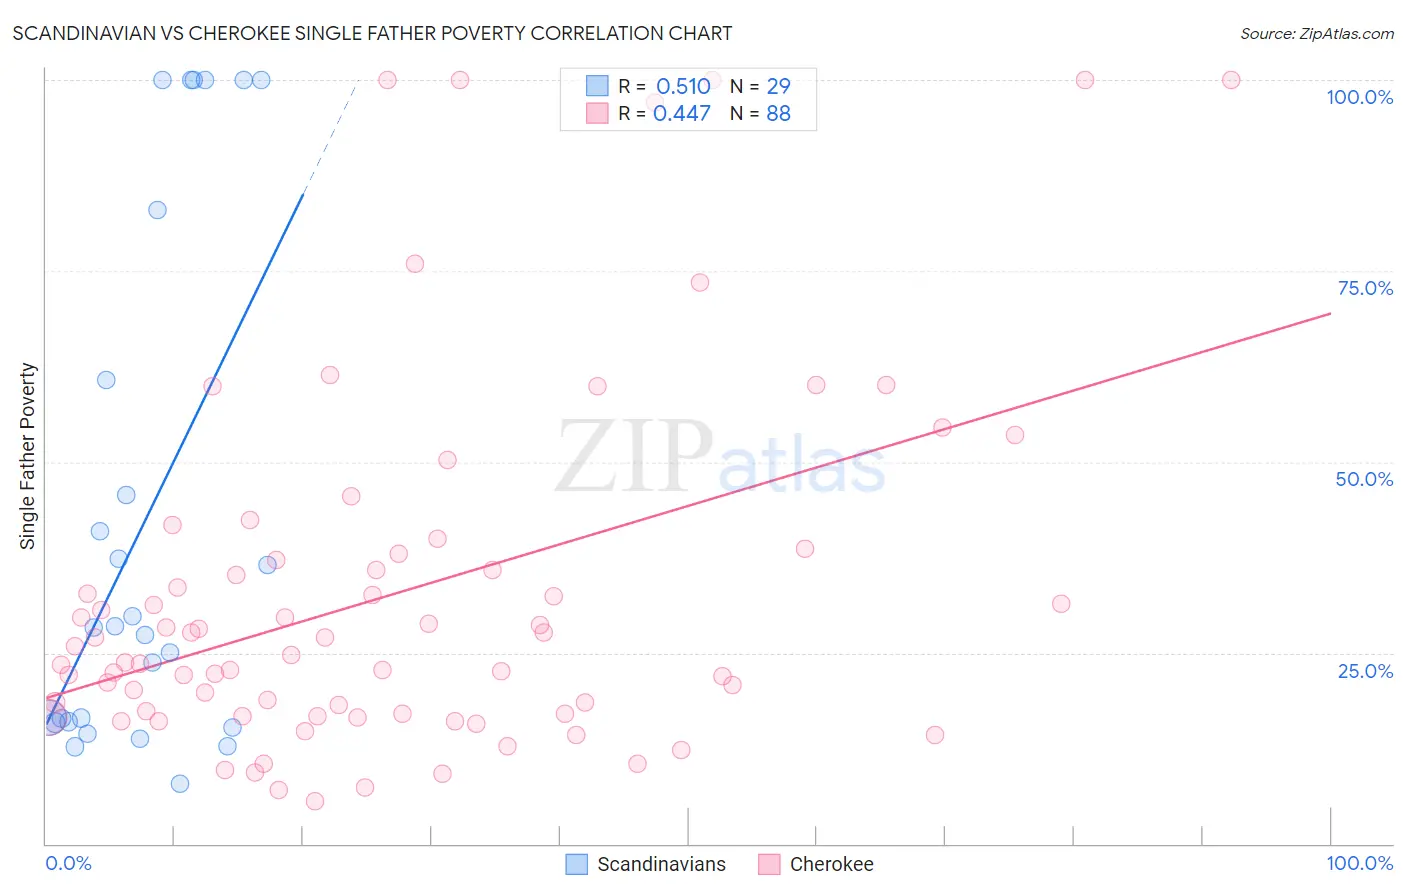
Scandinavian vs Cherokee Single Father Poverty Correlation Chart
The statistical analysis conducted on geographies consisting of 353,551,665 people shows a substantial positive correlation between the proportion of Scandinavians and poverty level among single fathers in the United States with a correlation coefficient (R) of 0.510 and weighted average of 16.3%. Similarly, the statistical analysis conducted on geographies consisting of 376,598,860 people shows a moderate positive correlation between the proportion of Cherokee and poverty level among single fathers in the United States with a correlation coefficient (R) of 0.447 and weighted average of 19.6%, a difference of 20.6%.
Single Father Poverty Correlation Summary
| Measurement | Scandinavian | Cherokee |
| Minimum | 7.8% | 5.6% |
| Maximum | 100.0% | 100.0% |
| Range | 92.2% | 94.4% |
| Mean | 42.2% | 32.7% |
| Median | 28.3% | 25.3% |
| Interquartile 25% (IQ1) | 15.9% | 17.1% |
| Interquartile 75% (IQ3) | 71.8% | 37.5% |
| Interquartile Range (IQR) | 55.9% | 20.4% |
| Standard Deviation (Sample) | 33.9% | 23.5% |
| Standard Deviation (Population) | 33.3% | 23.4% |
Similar Demographics by Single Father Poverty
Demographics Similar to Scandinavians by Single Father Poverty
In terms of single father poverty, the demographic groups most similar to Scandinavians are Northern European (16.3%, a difference of 0.020%), Costa Rican (16.3%, a difference of 0.060%), Yugoslavian (16.3%, a difference of 0.070%), Immigrants from Morocco (16.3%, a difference of 0.070%), and Immigrants from Sierra Leone (16.3%, a difference of 0.10%).
| Demographics | Rating | Rank | Single Father Poverty |
| Immigrants | Costa Rica | 55.7 /100 | #163 | Average 16.3% |
| Guyanese | 55.2 /100 | #164 | Average 16.3% |
| Immigrants | Bangladesh | 55.1 /100 | #165 | Average 16.3% |
| Immigrants | Europe | 54.8 /100 | #166 | Average 16.3% |
| Yugoslavians | 53.9 /100 | #167 | Average 16.3% |
| Costa Ricans | 53.6 /100 | #168 | Average 16.3% |
| Northern Europeans | 52.8 /100 | #169 | Average 16.3% |
| Scandinavians | 52.3 /100 | #170 | Average 16.3% |
| Immigrants | Morocco | 50.7 /100 | #171 | Average 16.3% |
| Immigrants | Sierra Leone | 50.1 /100 | #172 | Average 16.3% |
| Immigrants | St. Vincent and the Grenadines | 50.0 /100 | #173 | Average 16.3% |
| Swedes | 50.0 /100 | #174 | Average 16.3% |
| Immigrants | Ecuador | 49.7 /100 | #175 | Average 16.3% |
| Vietnamese | 48.0 /100 | #176 | Average 16.3% |
| Immigrants | South Africa | 44.2 /100 | #177 | Average 16.3% |
Demographics Similar to Cherokee by Single Father Poverty
In terms of single father poverty, the demographic groups most similar to Cherokee are Inupiat (19.5%, a difference of 0.85%), Creek (19.8%, a difference of 1.0%), Slovak (19.3%, a difference of 1.8%), Pennsylvania German (20.0%, a difference of 1.9%), and American (20.1%, a difference of 2.1%).
| Demographics | Rating | Rank | Single Father Poverty |
| Delaware | 0.0 /100 | #314 | Tragic 18.9% |
| Chickasaw | 0.0 /100 | #315 | Tragic 19.0% |
| Osage | 0.0 /100 | #316 | Tragic 19.0% |
| Dominicans | 0.0 /100 | #317 | Tragic 19.1% |
| Dutch West Indians | 0.0 /100 | #318 | Tragic 19.2% |
| Slovaks | 0.0 /100 | #319 | Tragic 19.3% |
| Inupiat | 0.0 /100 | #320 | Tragic 19.5% |
| Cherokee | 0.0 /100 | #321 | Tragic 19.6% |
| Creek | 0.0 /100 | #322 | Tragic 19.8% |
| Pennsylvania Germans | 0.0 /100 | #323 | Tragic 20.0% |
| Americans | 0.0 /100 | #324 | Tragic 20.1% |
| Blacks/African Americans | 0.0 /100 | #325 | Tragic 20.4% |
| Immigrants | Yemen | 0.0 /100 | #326 | Tragic 20.6% |
| Choctaw | 0.0 /100 | #327 | Tragic 20.7% |
| Pueblo | 0.0 /100 | #328 | Tragic 21.1% |