Bhutanese vs Cherokee Single Father Poverty
COMPARE
Bhutanese
Cherokee
Single Father Poverty
Single Father Poverty Comparison
Bhutanese
Cherokee
15.0%
SINGLE FATHER POVERTY
99.9/ 100
METRIC RATING
50th/ 347
METRIC RANK
19.6%
SINGLE FATHER POVERTY
0.0/ 100
METRIC RATING
321st/ 347
METRIC RANK
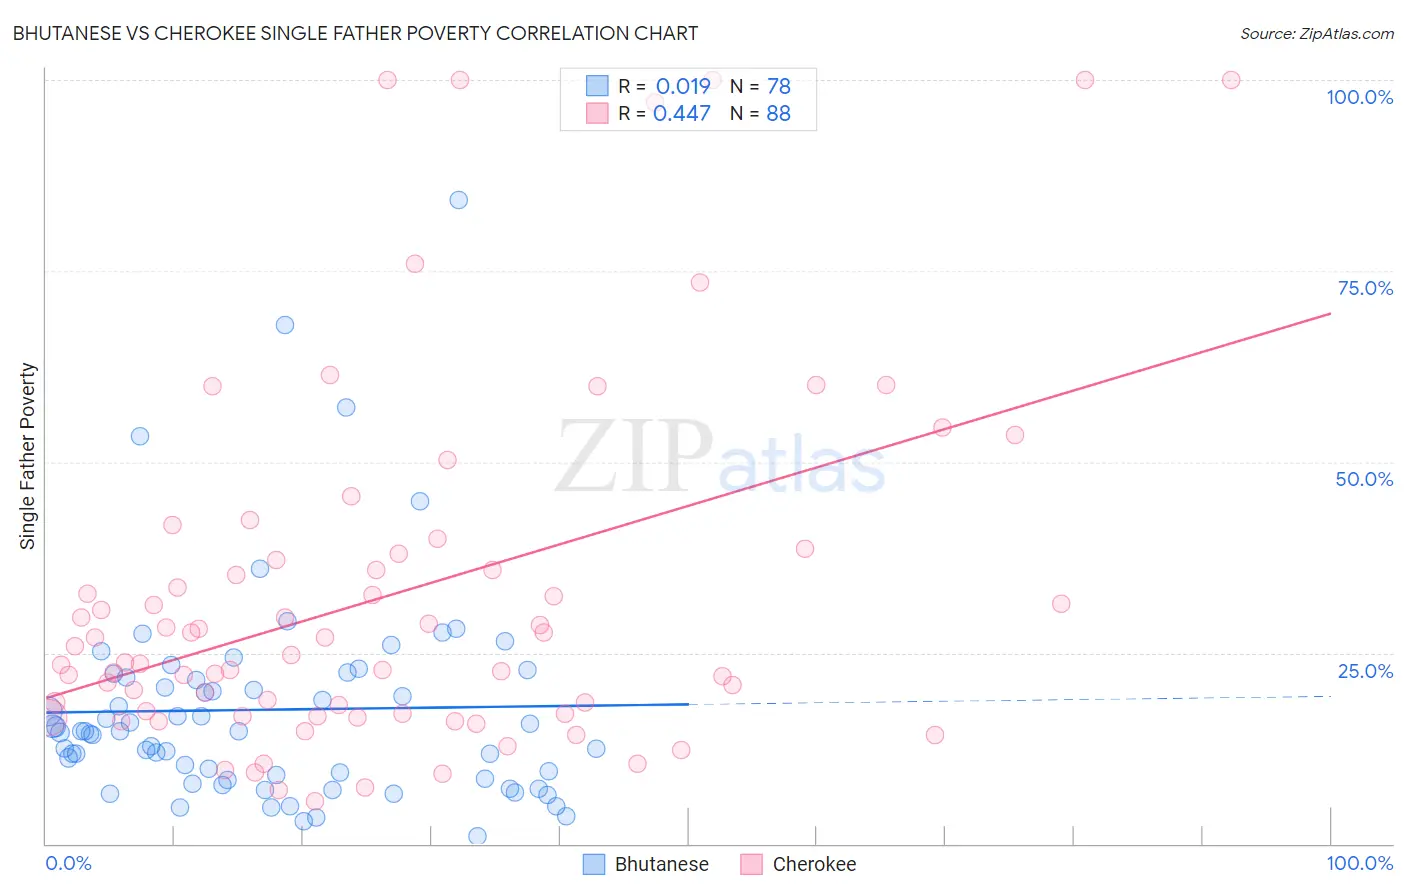
Bhutanese vs Cherokee Single Father Poverty Correlation Chart
The statistical analysis conducted on geographies consisting of 350,288,163 people shows no correlation between the proportion of Bhutanese and poverty level among single fathers in the United States with a correlation coefficient (R) of 0.019 and weighted average of 15.0%. Similarly, the statistical analysis conducted on geographies consisting of 376,598,860 people shows a moderate positive correlation between the proportion of Cherokee and poverty level among single fathers in the United States with a correlation coefficient (R) of 0.447 and weighted average of 19.6%, a difference of 31.2%.
Single Father Poverty Correlation Summary
| Measurement | Bhutanese | Cherokee |
| Minimum | 0.92% | 5.6% |
| Maximum | 84.3% | 100.0% |
| Range | 83.3% | 94.4% |
| Mean | 17.6% | 32.7% |
| Median | 14.7% | 25.3% |
| Interquartile 25% (IQ1) | 8.5% | 17.1% |
| Interquartile 75% (IQ3) | 21.8% | 37.5% |
| Interquartile Range (IQR) | 13.3% | 20.4% |
| Standard Deviation (Sample) | 14.1% | 23.5% |
| Standard Deviation (Population) | 14.0% | 23.4% |
Similar Demographics by Single Father Poverty
Demographics Similar to Bhutanese by Single Father Poverty
In terms of single father poverty, the demographic groups most similar to Bhutanese are Immigrants from Pakistan (15.0%, a difference of 0.020%), Immigrants from Eastern Asia (15.0%, a difference of 0.050%), Immigrants from El Salvador (15.0%, a difference of 0.060%), Immigrants from Kenya (15.0%, a difference of 0.090%), and Immigrants from China (14.9%, a difference of 0.21%).
| Demographics | Rating | Rank | Single Father Poverty |
| Immigrants | Eritrea | 100.0 /100 | #43 | Exceptional 14.8% |
| Salvadorans | 100.0 /100 | #44 | Exceptional 14.9% |
| Immigrants | Somalia | 100.0 /100 | #45 | Exceptional 14.9% |
| Immigrants | Cambodia | 99.9 /100 | #46 | Exceptional 14.9% |
| Immigrants | China | 99.9 /100 | #47 | Exceptional 14.9% |
| Malaysians | 99.9 /100 | #48 | Exceptional 14.9% |
| Immigrants | Eastern Asia | 99.9 /100 | #49 | Exceptional 15.0% |
| Bhutanese | 99.9 /100 | #50 | Exceptional 15.0% |
| Immigrants | Pakistan | 99.9 /100 | #51 | Exceptional 15.0% |
| Immigrants | El Salvador | 99.9 /100 | #52 | Exceptional 15.0% |
| Immigrants | Kenya | 99.9 /100 | #53 | Exceptional 15.0% |
| Immigrants | Uzbekistan | 99.9 /100 | #54 | Exceptional 15.0% |
| Immigrants | Bulgaria | 99.9 /100 | #55 | Exceptional 15.0% |
| Immigrants | Laos | 99.9 /100 | #56 | Exceptional 15.1% |
| Laotians | 99.9 /100 | #57 | Exceptional 15.1% |
Demographics Similar to Cherokee by Single Father Poverty
In terms of single father poverty, the demographic groups most similar to Cherokee are Inupiat (19.5%, a difference of 0.85%), Creek (19.8%, a difference of 1.0%), Slovak (19.3%, a difference of 1.8%), Pennsylvania German (20.0%, a difference of 1.9%), and American (20.1%, a difference of 2.1%).
| Demographics | Rating | Rank | Single Father Poverty |
| Delaware | 0.0 /100 | #314 | Tragic 18.9% |
| Chickasaw | 0.0 /100 | #315 | Tragic 19.0% |
| Osage | 0.0 /100 | #316 | Tragic 19.0% |
| Dominicans | 0.0 /100 | #317 | Tragic 19.1% |
| Dutch West Indians | 0.0 /100 | #318 | Tragic 19.2% |
| Slovaks | 0.0 /100 | #319 | Tragic 19.3% |
| Inupiat | 0.0 /100 | #320 | Tragic 19.5% |
| Cherokee | 0.0 /100 | #321 | Tragic 19.6% |
| Creek | 0.0 /100 | #322 | Tragic 19.8% |
| Pennsylvania Germans | 0.0 /100 | #323 | Tragic 20.0% |
| Americans | 0.0 /100 | #324 | Tragic 20.1% |
| Blacks/African Americans | 0.0 /100 | #325 | Tragic 20.4% |
| Immigrants | Yemen | 0.0 /100 | #326 | Tragic 20.6% |
| Choctaw | 0.0 /100 | #327 | Tragic 20.7% |
| Pueblo | 0.0 /100 | #328 | Tragic 21.1% |