Samoan vs South American Indian Births to Unmarried Women
COMPARE
Samoan
South American Indian
Births to Unmarried Women
Births to Unmarried Women Comparison
Samoans
South American Indians
32.6%
BIRTHS TO UNMARRIED WOMEN
21.9/ 100
METRIC RATING
195th/ 347
METRIC RANK
31.7%
BIRTHS TO UNMARRIED WOMEN
47.7/ 100
METRIC RATING
177th/ 347
METRIC RANK
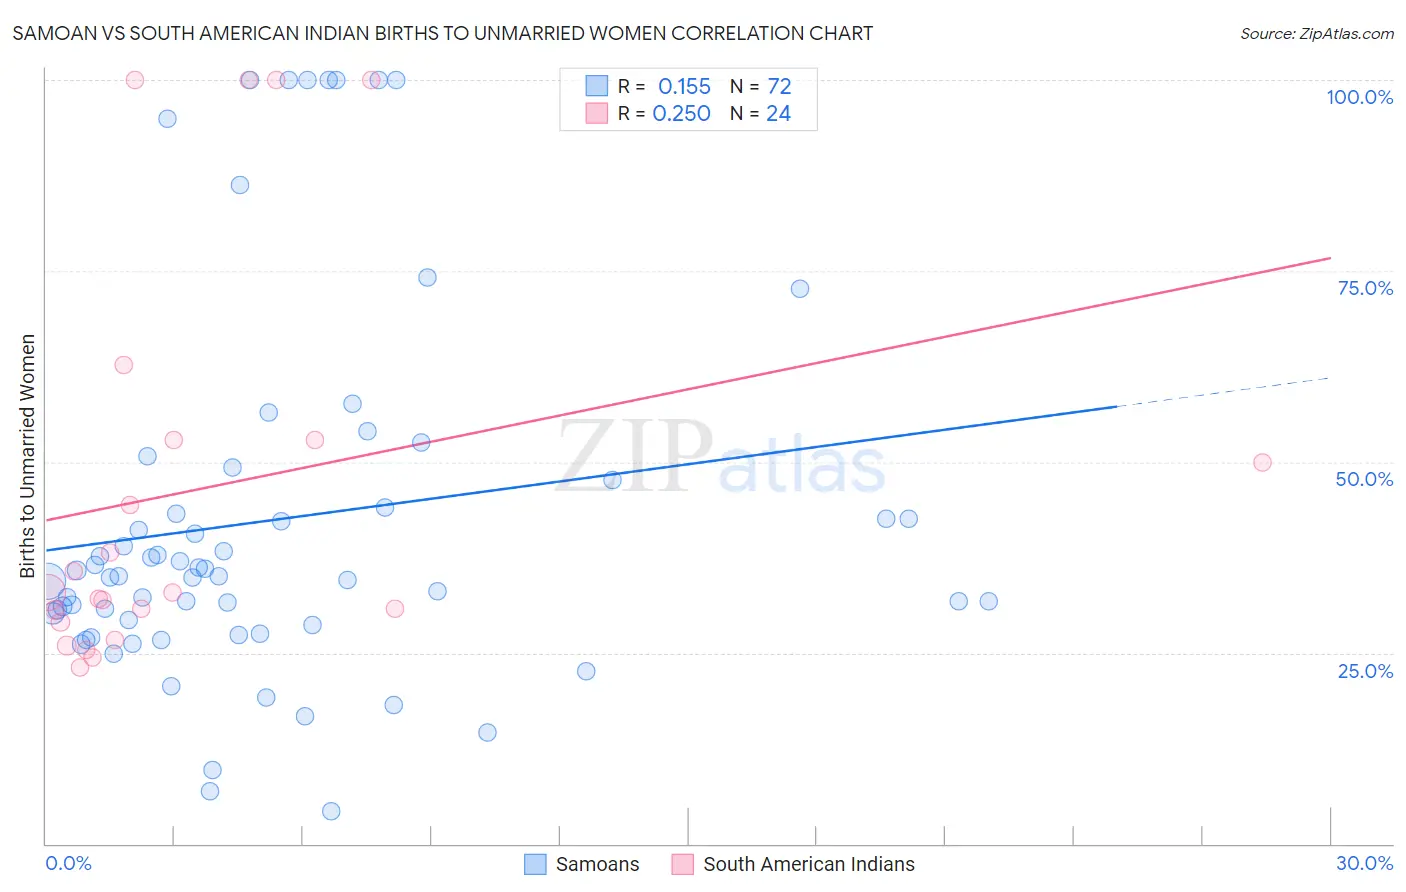
Samoan vs South American Indian Births to Unmarried Women Correlation Chart
The statistical analysis conducted on geographies consisting of 217,867,082 people shows a poor positive correlation between the proportion of Samoans and percentage of births to unmarried women in the United States with a correlation coefficient (R) of 0.155 and weighted average of 32.6%. Similarly, the statistical analysis conducted on geographies consisting of 159,564,044 people shows a weak positive correlation between the proportion of South American Indians and percentage of births to unmarried women in the United States with a correlation coefficient (R) of 0.250 and weighted average of 31.7%, a difference of 2.8%.
Births to Unmarried Women Correlation Summary
| Measurement | Samoan | South American Indian |
| Minimum | 4.3% | 23.0% |
| Maximum | 100.0% | 100.0% |
| Range | 95.7% | 77.0% |
| Mean | 42.4% | 46.4% |
| Median | 35.0% | 32.9% |
| Interquartile 25% (IQ1) | 28.9% | 29.9% |
| Interquartile 75% (IQ3) | 45.8% | 52.9% |
| Interquartile Range (IQR) | 16.9% | 23.0% |
| Standard Deviation (Sample) | 24.4% | 26.5% |
| Standard Deviation (Population) | 24.2% | 25.9% |
Demographics Similar to Samoans and South American Indians by Births to Unmarried Women
In terms of births to unmarried women, the demographic groups most similar to Samoans are Immigrants from Colombia (32.6%, a difference of 0.030%), Sudanese (32.4%, a difference of 0.67%), Fijian (32.3%, a difference of 1.1%), Colombian (32.2%, a difference of 1.2%), and Irish (32.2%, a difference of 1.2%). Similarly, the demographic groups most similar to South American Indians are English (31.7%, a difference of 0.030%), Scottish (31.7%, a difference of 0.040%), South American (31.8%, a difference of 0.070%), Moroccan (31.8%, a difference of 0.18%), and Immigrants from Peru (31.8%, a difference of 0.25%).
| Demographics | Rating | Rank | Births to Unmarried Women |
| Scottish | 48.1 /100 | #176 | Average 31.7% |
| South American Indians | 47.7 /100 | #177 | Average 31.7% |
| English | 47.4 /100 | #178 | Average 31.7% |
| South Americans | 46.9 /100 | #179 | Average 31.8% |
| Moroccans | 45.7 /100 | #180 | Average 31.8% |
| Immigrants | Peru | 45.1 /100 | #181 | Average 31.8% |
| Kenyans | 43.0 /100 | #182 | Average 31.9% |
| Canadians | 41.4 /100 | #183 | Average 31.9% |
| Immigrants | South America | 40.7 /100 | #184 | Average 32.0% |
| Germans | 39.5 /100 | #185 | Fair 32.0% |
| Welsh | 38.2 /100 | #186 | Fair 32.0% |
| Czechoslovakians | 38.0 /100 | #187 | Fair 32.0% |
| Osage | 37.1 /100 | #188 | Fair 32.1% |
| Immigrants | Kenya | 36.9 /100 | #189 | Fair 32.1% |
| Tlingit-Haida | 32.6 /100 | #190 | Fair 32.2% |
| Irish | 32.4 /100 | #191 | Fair 32.2% |
| Colombians | 31.9 /100 | #192 | Fair 32.2% |
| Fijians | 31.1 /100 | #193 | Fair 32.3% |
| Sudanese | 27.3 /100 | #194 | Fair 32.4% |
| Samoans | 21.9 /100 | #195 | Fair 32.6% |
| Immigrants | Colombia | 21.7 /100 | #196 | Fair 32.6% |