Palestinian vs South American Indian Male Poverty
COMPARE
Palestinian
South American Indian
Male Poverty
Male Poverty Comparison
Palestinians
South American Indians
10.6%
MALE POVERTY
89.1/ 100
METRIC RATING
113th/ 347
METRIC RANK
11.5%
MALE POVERTY
22.8/ 100
METRIC RATING
191st/ 347
METRIC RANK
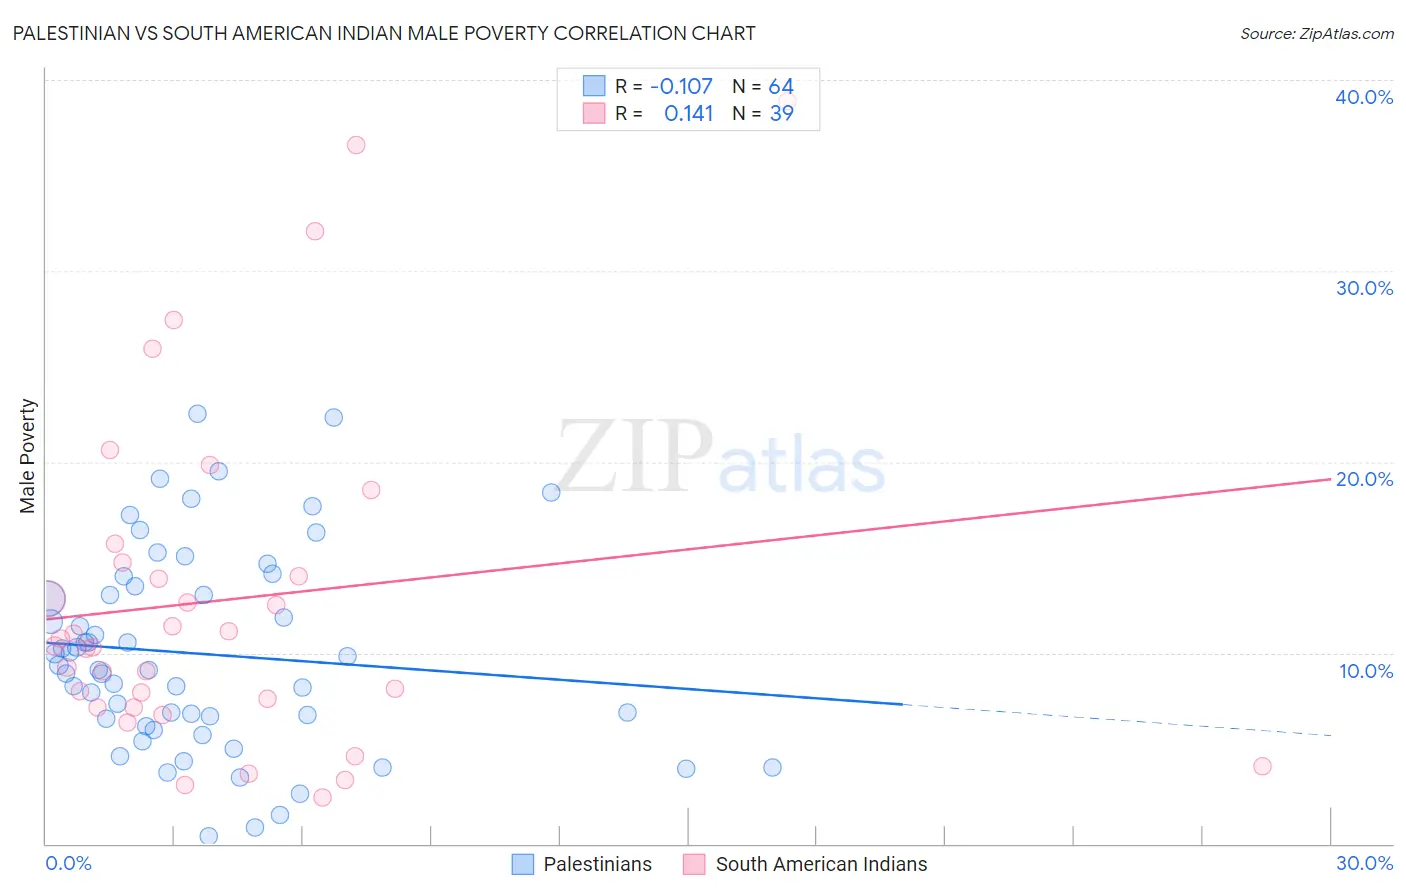
Palestinian vs South American Indian Male Poverty Correlation Chart
The statistical analysis conducted on geographies consisting of 216,357,204 people shows a poor negative correlation between the proportion of Palestinians and poverty level among males in the United States with a correlation coefficient (R) of -0.107 and weighted average of 10.6%. Similarly, the statistical analysis conducted on geographies consisting of 164,512,423 people shows a poor positive correlation between the proportion of South American Indians and poverty level among males in the United States with a correlation coefficient (R) of 0.141 and weighted average of 11.5%, a difference of 8.6%.
Male Poverty Correlation Summary
| Measurement | Palestinian | South American Indian |
| Minimum | 0.38% | 2.4% |
| Maximum | 22.5% | 38.9% |
| Range | 22.1% | 36.5% |
| Mean | 9.9% | 12.8% |
| Median | 9.2% | 10.3% |
| Interquartile 25% (IQ1) | 6.3% | 7.1% |
| Interquartile 75% (IQ3) | 13.3% | 14.7% |
| Interquartile Range (IQR) | 6.9% | 7.6% |
| Standard Deviation (Sample) | 5.2% | 8.9% |
| Standard Deviation (Population) | 5.2% | 8.8% |
Similar Demographics by Male Poverty
Demographics Similar to Palestinians by Male Poverty
In terms of male poverty, the demographic groups most similar to Palestinians are Immigrants from Brazil (10.6%, a difference of 0.020%), Immigrants from Turkey (10.6%, a difference of 0.10%), Immigrants from Russia (10.6%, a difference of 0.14%), Immigrants from Argentina (10.6%, a difference of 0.18%), and Sri Lankan (10.6%, a difference of 0.25%).
| Demographics | Rating | Rank | Male Poverty |
| Immigrants | Southern Europe | 91.3 /100 | #106 | Exceptional 10.5% |
| Laotians | 91.2 /100 | #107 | Exceptional 10.5% |
| Portuguese | 91.0 /100 | #108 | Exceptional 10.6% |
| Albanians | 90.6 /100 | #109 | Exceptional 10.6% |
| Argentineans | 90.1 /100 | #110 | Exceptional 10.6% |
| Immigrants | Argentina | 89.8 /100 | #111 | Excellent 10.6% |
| Immigrants | Turkey | 89.5 /100 | #112 | Excellent 10.6% |
| Palestinians | 89.1 /100 | #113 | Excellent 10.6% |
| Immigrants | Brazil | 89.0 /100 | #114 | Excellent 10.6% |
| Immigrants | Russia | 88.6 /100 | #115 | Excellent 10.6% |
| Sri Lankans | 88.1 /100 | #116 | Excellent 10.6% |
| Immigrants | South Eastern Asia | 88.1 /100 | #117 | Excellent 10.6% |
| Okinawans | 87.6 /100 | #118 | Excellent 10.7% |
| Immigrants | Hungary | 87.6 /100 | #119 | Excellent 10.7% |
| Immigrants | China | 87.1 /100 | #120 | Excellent 10.7% |
Demographics Similar to South American Indians by Male Poverty
In terms of male poverty, the demographic groups most similar to South American Indians are Israeli (11.5%, a difference of 0.43%), Immigrants from Uruguay (11.6%, a difference of 0.52%), Hawaiian (11.4%, a difference of 0.70%), Immigrants from Kuwait (11.6%, a difference of 0.81%), and Sierra Leonean (11.4%, a difference of 0.88%).
| Demographics | Rating | Rank | Male Poverty |
| Immigrants | South America | 36.9 /100 | #184 | Fair 11.3% |
| Immigrants | Afghanistan | 33.3 /100 | #185 | Fair 11.4% |
| Immigrants | Sierra Leone | 32.9 /100 | #186 | Fair 11.4% |
| Immigrants | Iraq | 31.9 /100 | #187 | Fair 11.4% |
| Sierra Leoneans | 29.9 /100 | #188 | Fair 11.4% |
| Hawaiians | 28.3 /100 | #189 | Fair 11.4% |
| Israelis | 26.1 /100 | #190 | Fair 11.5% |
| South American Indians | 22.8 /100 | #191 | Fair 11.5% |
| Immigrants | Uruguay | 19.1 /100 | #192 | Poor 11.6% |
| Immigrants | Kuwait | 17.3 /100 | #193 | Poor 11.6% |
| Immigrants | Kenya | 16.1 /100 | #194 | Poor 11.6% |
| Arabs | 15.8 /100 | #195 | Poor 11.6% |
| Hmong | 15.8 /100 | #196 | Poor 11.6% |
| Delaware | 15.4 /100 | #197 | Poor 11.7% |
| Iraqis | 14.7 /100 | #198 | Poor 11.7% |