Honduran vs Immigrants from South Eastern Asia Family Poverty
COMPARE
Honduran
Immigrants from South Eastern Asia
Family Poverty
Family Poverty Comparison
Hondurans
Immigrants from South Eastern Asia
12.4%
FAMILY POVERTY
0.0/ 100
METRIC RATING
316th/ 347
METRIC RANK
8.5%
FAMILY POVERTY
83.2/ 100
METRIC RATING
145th/ 347
METRIC RANK
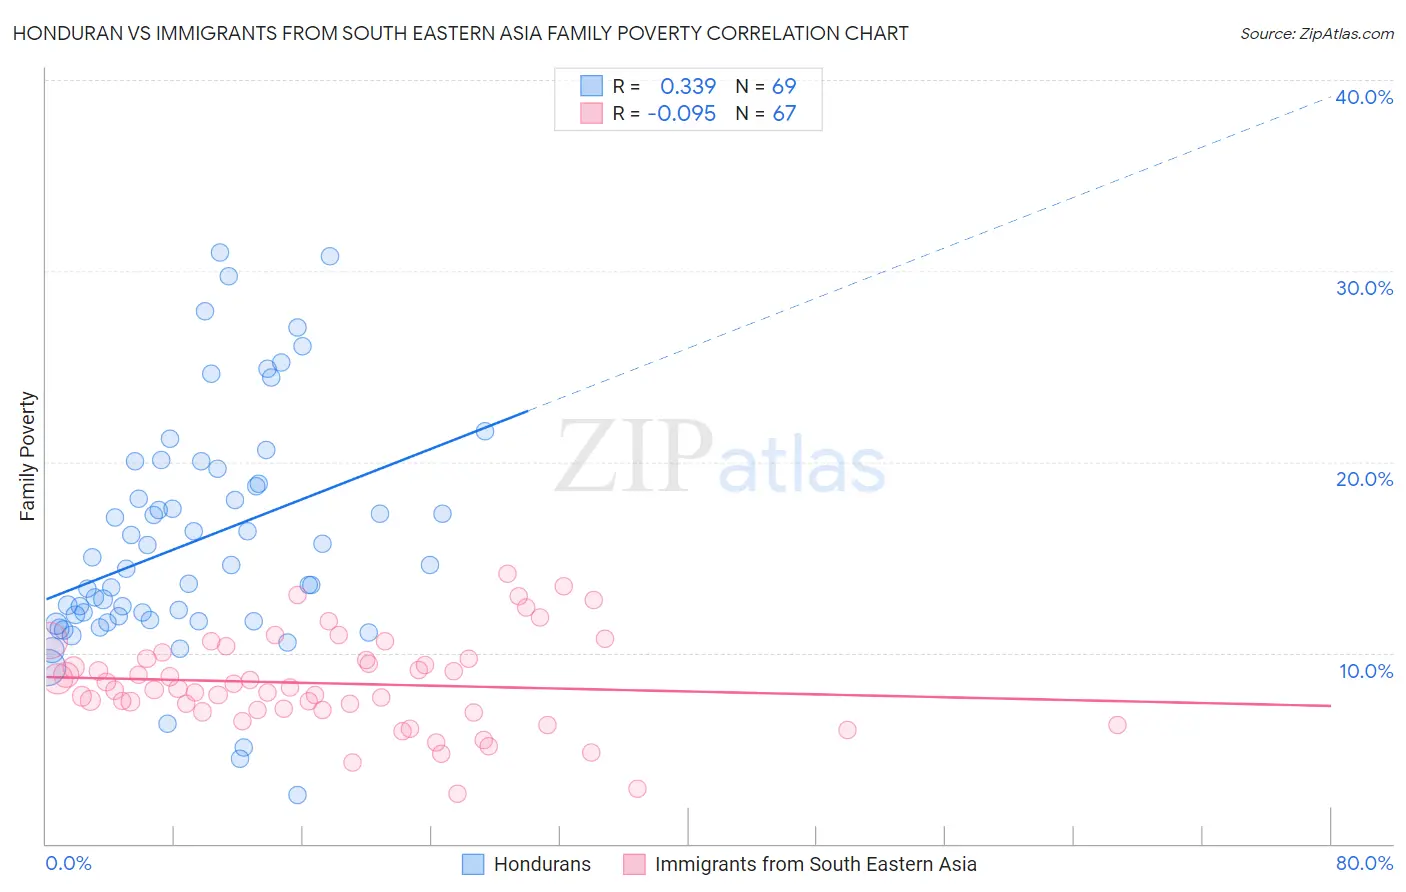
Honduran vs Immigrants from South Eastern Asia Family Poverty Correlation Chart
The statistical analysis conducted on geographies consisting of 357,202,991 people shows a mild positive correlation between the proportion of Hondurans and poverty level among families in the United States with a correlation coefficient (R) of 0.339 and weighted average of 12.4%. Similarly, the statistical analysis conducted on geographies consisting of 510,315,048 people shows a slight negative correlation between the proportion of Immigrants from South Eastern Asia and poverty level among families in the United States with a correlation coefficient (R) of -0.095 and weighted average of 8.5%, a difference of 44.9%.
Family Poverty Correlation Summary
| Measurement | Honduran | Immigrants from South Eastern Asia |
| Minimum | 2.5% | 2.6% |
| Maximum | 31.0% | 14.1% |
| Range | 28.4% | 11.5% |
| Mean | 15.9% | 8.4% |
| Median | 14.6% | 8.1% |
| Interquartile 25% (IQ1) | 11.7% | 7.0% |
| Interquartile 75% (IQ3) | 19.2% | 9.7% |
| Interquartile Range (IQR) | 7.5% | 2.7% |
| Standard Deviation (Sample) | 6.1% | 2.4% |
| Standard Deviation (Population) | 6.1% | 2.4% |
Similar Demographics by Family Poverty
Demographics Similar to Hondurans by Family Poverty
In terms of family poverty, the demographic groups most similar to Hondurans are Immigrants from Grenada (12.4%, a difference of 0.22%), U.S. Virgin Islander (12.4%, a difference of 0.22%), British West Indian (12.4%, a difference of 0.27%), Immigrants from Mexico (12.3%, a difference of 0.74%), and Inupiat (12.5%, a difference of 0.76%).
| Demographics | Rating | Rank | Family Poverty |
| Hispanics or Latinos | 0.0 /100 | #309 | Tragic 12.0% |
| Immigrants | Guatemala | 0.0 /100 | #310 | Tragic 12.0% |
| Ute | 0.0 /100 | #311 | Tragic 12.1% |
| Immigrants | Central America | 0.0 /100 | #312 | Tragic 12.1% |
| Immigrants | Caribbean | 0.0 /100 | #313 | Tragic 12.2% |
| Kiowa | 0.0 /100 | #314 | Tragic 12.2% |
| Immigrants | Mexico | 0.0 /100 | #315 | Tragic 12.3% |
| Hondurans | 0.0 /100 | #316 | Tragic 12.4% |
| Immigrants | Grenada | 0.0 /100 | #317 | Tragic 12.4% |
| U.S. Virgin Islanders | 0.0 /100 | #318 | Tragic 12.4% |
| British West Indians | 0.0 /100 | #319 | Tragic 12.4% |
| Inupiat | 0.0 /100 | #320 | Tragic 12.5% |
| Arapaho | 0.0 /100 | #321 | Tragic 12.7% |
| Immigrants | Honduras | 0.0 /100 | #322 | Tragic 12.7% |
| Menominee | 0.0 /100 | #323 | Tragic 12.7% |
Demographics Similar to Immigrants from South Eastern Asia by Family Poverty
In terms of family poverty, the demographic groups most similar to Immigrants from South Eastern Asia are Immigrants from Belarus (8.5%, a difference of 0.010%), Albanian (8.5%, a difference of 0.020%), Immigrants from Germany (8.5%, a difference of 0.040%), Immigrants from Jordan (8.5%, a difference of 0.050%), and Yugoslavian (8.5%, a difference of 0.070%).
| Demographics | Rating | Rank | Family Poverty |
| Armenians | 84.6 /100 | #138 | Excellent 8.5% |
| Immigrants | Nepal | 84.2 /100 | #139 | Excellent 8.5% |
| Immigrants | Kazakhstan | 84.1 /100 | #140 | Excellent 8.5% |
| Immigrants | Ukraine | 83.9 /100 | #141 | Excellent 8.5% |
| Yugoslavians | 83.5 /100 | #142 | Excellent 8.5% |
| Immigrants | Germany | 83.3 /100 | #143 | Excellent 8.5% |
| Albanians | 83.3 /100 | #144 | Excellent 8.5% |
| Immigrants | South Eastern Asia | 83.2 /100 | #145 | Excellent 8.5% |
| Immigrants | Belarus | 83.2 /100 | #146 | Excellent 8.5% |
| Immigrants | Jordan | 83.0 /100 | #147 | Excellent 8.5% |
| Scotch-Irish | 82.2 /100 | #148 | Excellent 8.6% |
| Mongolians | 80.4 /100 | #149 | Excellent 8.6% |
| Syrians | 80.3 /100 | #150 | Excellent 8.6% |
| Brazilians | 80.1 /100 | #151 | Excellent 8.6% |
| Samoans | 79.8 /100 | #152 | Good 8.6% |