Samoan vs Hopi Doctorate Degree
COMPARE
Samoan
Hopi
Doctorate Degree
Doctorate Degree Comparison
Samoans
Hopi
1.4%
DOCTORATE DEGREE
0.2/ 100
METRIC RATING
294th/ 347
METRIC RANK
1.6%
DOCTORATE DEGREE
3.2/ 100
METRIC RATING
234th/ 347
METRIC RANK
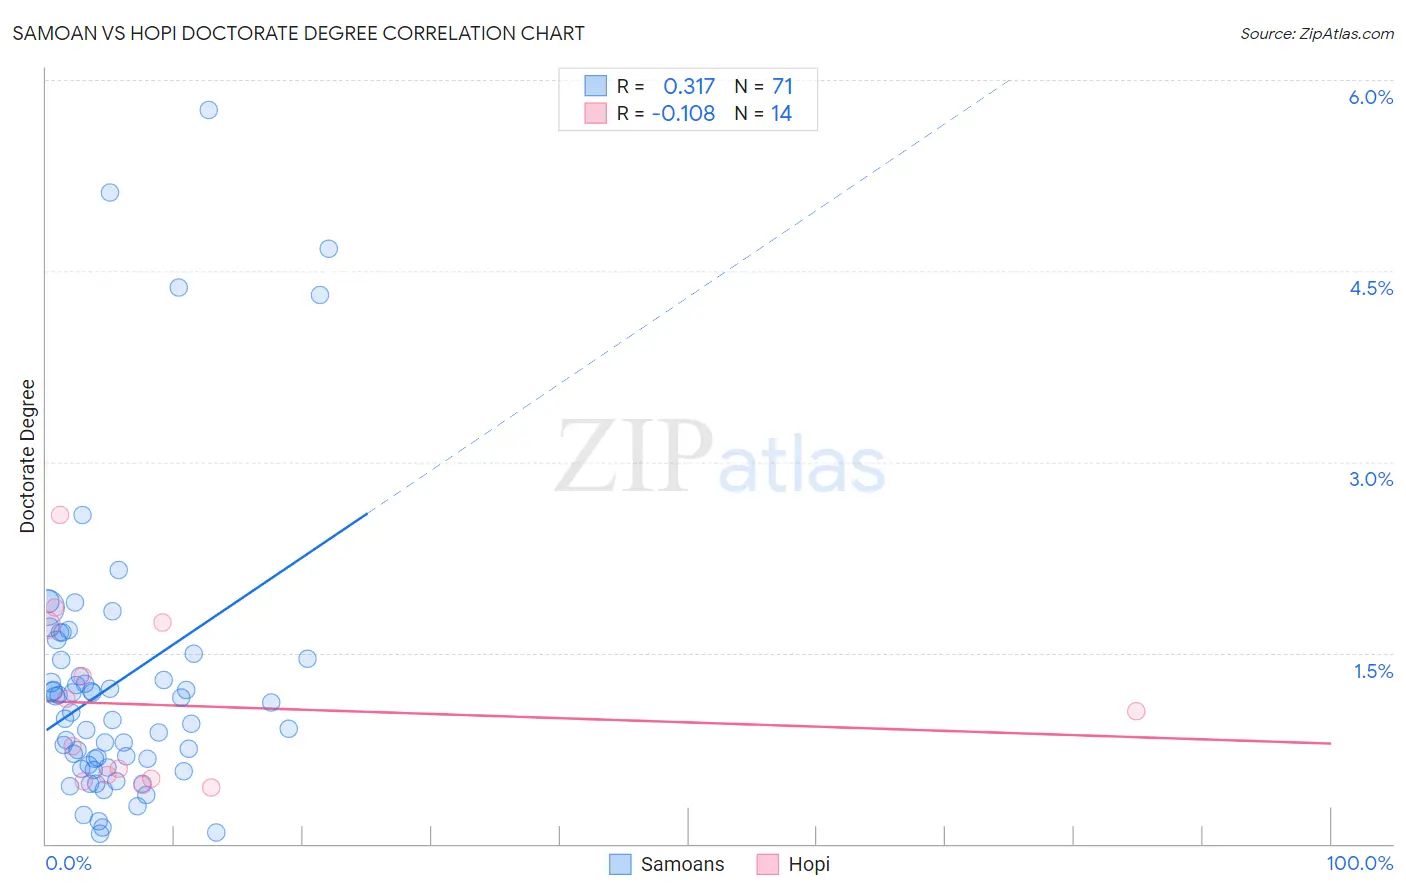
Samoan vs Hopi Doctorate Degree Correlation Chart
The statistical analysis conducted on geographies consisting of 223,690,736 people shows a mild positive correlation between the proportion of Samoans and percentage of population with at least doctorate degree education in the United States with a correlation coefficient (R) of 0.317 and weighted average of 1.4%. Similarly, the statistical analysis conducted on geographies consisting of 74,389,288 people shows a poor negative correlation between the proportion of Hopi and percentage of population with at least doctorate degree education in the United States with a correlation coefficient (R) of -0.108 and weighted average of 1.6%, a difference of 13.1%.
Doctorate Degree Correlation Summary
| Measurement | Samoan | Hopi |
| Minimum | 0.079% | 0.44% |
| Maximum | 5.8% | 2.6% |
| Range | 5.7% | 2.1% |
| Mean | 1.3% | 1.1% |
| Median | 1.0% | 0.90% |
| Interquartile 25% (IQ1) | 0.61% | 0.51% |
| Interquartile 75% (IQ3) | 1.4% | 1.7% |
| Interquartile Range (IQR) | 0.83% | 1.2% |
| Standard Deviation (Sample) | 1.1% | 0.67% |
| Standard Deviation (Population) | 1.1% | 0.65% |
Similar Demographics by Doctorate Degree
Demographics Similar to Samoans by Doctorate Degree
In terms of doctorate degree, the demographic groups most similar to Samoans are Guatemalan (1.4%, a difference of 0.70%), Immigrants from Yemen (1.4%, a difference of 0.71%), Immigrants from Ecuador (1.4%, a difference of 0.94%), Tsimshian (1.4%, a difference of 1.1%), and Alaska Native (1.4%, a difference of 1.3%).
| Demographics | Rating | Rank | Doctorate Degree |
| Cajuns | 0.3 /100 | #287 | Tragic 1.5% |
| Immigrants | El Salvador | 0.3 /100 | #288 | Tragic 1.4% |
| Cape Verdeans | 0.3 /100 | #289 | Tragic 1.4% |
| Choctaw | 0.3 /100 | #290 | Tragic 1.4% |
| Blacks/African Americans | 0.3 /100 | #291 | Tragic 1.4% |
| Alaska Natives | 0.3 /100 | #292 | Tragic 1.4% |
| Immigrants | Yemen | 0.2 /100 | #293 | Tragic 1.4% |
| Samoans | 0.2 /100 | #294 | Tragic 1.4% |
| Guatemalans | 0.2 /100 | #295 | Tragic 1.4% |
| Immigrants | Ecuador | 0.2 /100 | #296 | Tragic 1.4% |
| Tsimshian | 0.2 /100 | #297 | Tragic 1.4% |
| Puerto Ricans | 0.1 /100 | #298 | Tragic 1.4% |
| Belizeans | 0.1 /100 | #299 | Tragic 1.4% |
| Immigrants | Guatemala | 0.1 /100 | #300 | Tragic 1.4% |
| Hondurans | 0.1 /100 | #301 | Tragic 1.4% |
Demographics Similar to Hopi by Doctorate Degree
In terms of doctorate degree, the demographic groups most similar to Hopi are Barbadian (1.6%, a difference of 0.15%), Guamanian/Chamorro (1.6%, a difference of 0.21%), Cree (1.6%, a difference of 0.21%), Indonesian (1.6%, a difference of 0.50%), and Iroquois (1.6%, a difference of 0.69%).
| Demographics | Rating | Rank | Doctorate Degree |
| Panamanians | 6.3 /100 | #227 | Tragic 1.7% |
| Assyrians/Chaldeans/Syriacs | 5.9 /100 | #228 | Tragic 1.7% |
| Colville | 4.7 /100 | #229 | Tragic 1.6% |
| Immigrants | Philippines | 4.3 /100 | #230 | Tragic 1.6% |
| Immigrants | North Macedonia | 3.9 /100 | #231 | Tragic 1.6% |
| Guamanians/Chamorros | 3.3 /100 | #232 | Tragic 1.6% |
| Barbadians | 3.3 /100 | #233 | Tragic 1.6% |
| Hopi | 3.2 /100 | #234 | Tragic 1.6% |
| Cree | 3.0 /100 | #235 | Tragic 1.6% |
| Indonesians | 2.8 /100 | #236 | Tragic 1.6% |
| Iroquois | 2.7 /100 | #237 | Tragic 1.6% |
| Immigrants | Congo | 2.6 /100 | #238 | Tragic 1.6% |
| West Indians | 2.5 /100 | #239 | Tragic 1.6% |
| Immigrants | Panama | 2.4 /100 | #240 | Tragic 1.6% |
| Cheyenne | 2.3 /100 | #241 | Tragic 1.6% |