Salvadoran vs Crow Single Mother Poverty
COMPARE
Salvadoran
Crow
Single Mother Poverty
Single Mother Poverty Comparison
Salvadorans
Crow
30.6%
SINGLE MOTHER POVERTY
1.8/ 100
METRIC RATING
240th/ 347
METRIC RANK
38.6%
SINGLE MOTHER POVERTY
0.0/ 100
METRIC RATING
339th/ 347
METRIC RANK
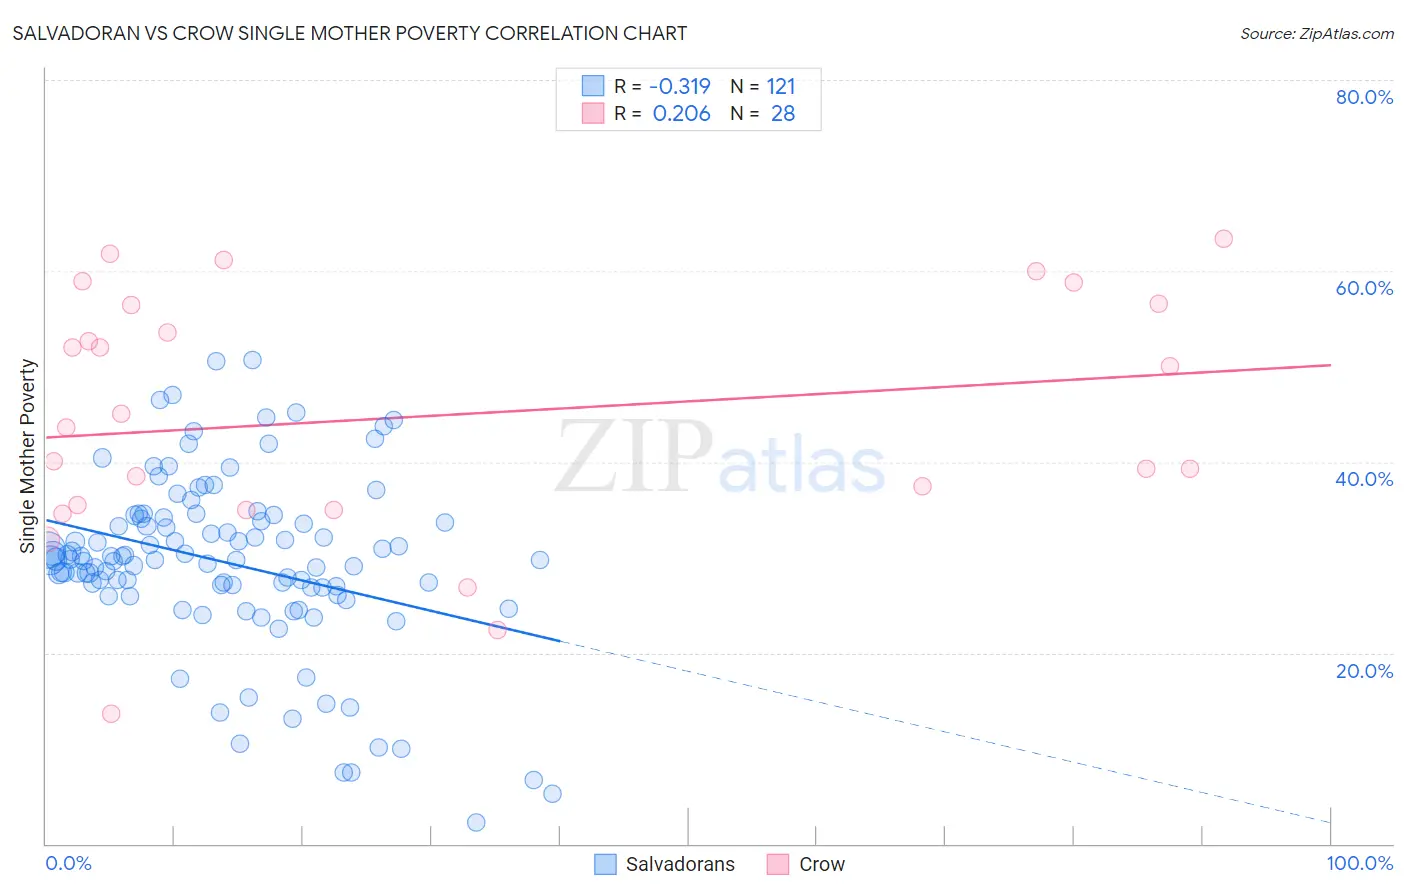
Salvadoran vs Crow Single Mother Poverty Correlation Chart
The statistical analysis conducted on geographies consisting of 391,766,529 people shows a mild negative correlation between the proportion of Salvadorans and poverty level among single mothers in the United States with a correlation coefficient (R) of -0.319 and weighted average of 30.6%. Similarly, the statistical analysis conducted on geographies consisting of 58,942,445 people shows a weak positive correlation between the proportion of Crow and poverty level among single mothers in the United States with a correlation coefficient (R) of 0.206 and weighted average of 38.6%, a difference of 26.4%.
Single Mother Poverty Correlation Summary
| Measurement | Salvadoran | Crow |
| Minimum | 2.2% | 13.6% |
| Maximum | 50.7% | 63.4% |
| Range | 48.5% | 49.8% |
| Mean | 29.5% | 44.8% |
| Median | 29.8% | 44.3% |
| Interquartile 25% (IQ1) | 26.8% | 35.2% |
| Interquartile 75% (IQ3) | 34.2% | 56.5% |
| Interquartile Range (IQR) | 7.3% | 21.3% |
| Standard Deviation (Sample) | 9.2% | 13.0% |
| Standard Deviation (Population) | 9.1% | 12.8% |
Similar Demographics by Single Mother Poverty
Demographics Similar to Salvadorans by Single Mother Poverty
In terms of single mother poverty, the demographic groups most similar to Salvadorans are Immigrants from Laos (30.6%, a difference of 0.050%), Immigrants from Burma/Myanmar (30.6%, a difference of 0.070%), Immigrants from Portugal (30.5%, a difference of 0.13%), Bermudan (30.6%, a difference of 0.15%), and French (30.7%, a difference of 0.37%).
| Demographics | Rating | Rank | Single Mother Poverty |
| Immigrants | Middle Africa | 3.5 /100 | #233 | Tragic 30.3% |
| Immigrants | Nicaragua | 3.5 /100 | #234 | Tragic 30.3% |
| Immigrants | Grenada | 3.4 /100 | #235 | Tragic 30.3% |
| Welsh | 3.2 /100 | #236 | Tragic 30.4% |
| Immigrants | St. Vincent and the Grenadines | 3.1 /100 | #237 | Tragic 30.4% |
| Slovaks | 2.8 /100 | #238 | Tragic 30.4% |
| Immigrants | Portugal | 2.1 /100 | #239 | Tragic 30.5% |
| Salvadorans | 1.8 /100 | #240 | Tragic 30.6% |
| Immigrants | Laos | 1.8 /100 | #241 | Tragic 30.6% |
| Immigrants | Burma/Myanmar | 1.7 /100 | #242 | Tragic 30.6% |
| Bermudans | 1.6 /100 | #243 | Tragic 30.6% |
| French | 1.3 /100 | #244 | Tragic 30.7% |
| Barbadians | 1.3 /100 | #245 | Tragic 30.7% |
| Ecuadorians | 0.9 /100 | #246 | Tragic 30.8% |
| West Indians | 0.9 /100 | #247 | Tragic 30.8% |
Demographics Similar to Crow by Single Mother Poverty
In terms of single mother poverty, the demographic groups most similar to Crow are Pima (38.6%, a difference of 0.090%), Immigrants from Yemen (38.5%, a difference of 0.30%), Cheyenne (38.5%, a difference of 0.34%), Sioux (38.8%, a difference of 0.40%), and Colville (39.3%, a difference of 1.7%).
| Demographics | Rating | Rank | Single Mother Poverty |
| Dutch West Indians | 0.0 /100 | #332 | Tragic 36.8% |
| Menominee | 0.0 /100 | #333 | Tragic 37.1% |
| Pueblo | 0.0 /100 | #334 | Tragic 37.2% |
| Yuman | 0.0 /100 | #335 | Tragic 37.8% |
| Cheyenne | 0.0 /100 | #336 | Tragic 38.5% |
| Immigrants | Yemen | 0.0 /100 | #337 | Tragic 38.5% |
| Pima | 0.0 /100 | #338 | Tragic 38.6% |
| Crow | 0.0 /100 | #339 | Tragic 38.6% |
| Sioux | 0.0 /100 | #340 | Tragic 38.8% |
| Colville | 0.0 /100 | #341 | Tragic 39.3% |
| Navajo | 0.0 /100 | #342 | Tragic 40.2% |
| Cajuns | 0.0 /100 | #343 | Tragic 40.3% |
| Tohono O'odham | 0.0 /100 | #344 | Tragic 43.0% |
| Lumbee | 0.0 /100 | #345 | Tragic 43.2% |
| Houma | 0.0 /100 | #346 | Tragic 43.5% |