Salvadoran vs Crow 9th Grade
COMPARE
Salvadoran
Crow
9th Grade
9th Grade Comparison
Salvadorans
Crow
89.6%
9TH GRADE
0.0/ 100
METRIC RATING
342nd/ 347
METRIC RANK
96.1%
9TH GRADE
99.9/ 100
METRIC RATING
45th/ 347
METRIC RANK
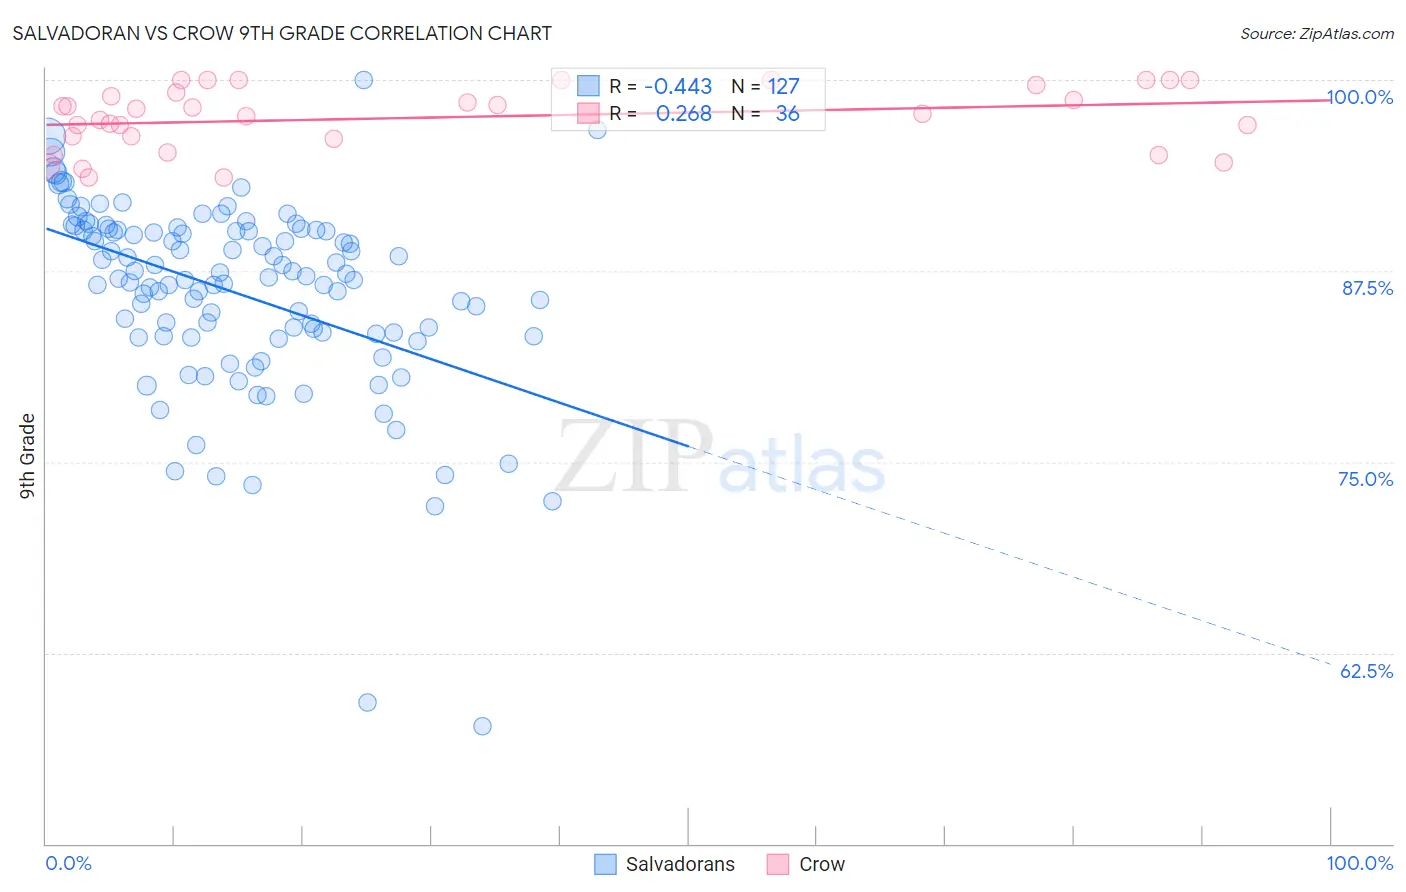
Salvadoran vs Crow 9th Grade Correlation Chart
The statistical analysis conducted on geographies consisting of 399,034,410 people shows a moderate negative correlation between the proportion of Salvadorans and percentage of population with at least 9th grade education in the United States with a correlation coefficient (R) of -0.443 and weighted average of 89.6%. Similarly, the statistical analysis conducted on geographies consisting of 59,209,980 people shows a weak positive correlation between the proportion of Crow and percentage of population with at least 9th grade education in the United States with a correlation coefficient (R) of 0.268 and weighted average of 96.1%, a difference of 7.2%.
9th Grade Correlation Summary
| Measurement | Salvadoran | Crow |
| Minimum | 57.7% | 93.6% |
| Maximum | 100.0% | 100.0% |
| Range | 42.3% | 6.4% |
| Mean | 86.0% | 97.5% |
| Median | 87.0% | 97.9% |
| Interquartile 25% (IQ1) | 83.2% | 96.3% |
| Interquartile 75% (IQ3) | 90.2% | 99.4% |
| Interquartile Range (IQR) | 7.0% | 3.2% |
| Standard Deviation (Sample) | 6.4% | 2.0% |
| Standard Deviation (Population) | 6.3% | 2.0% |
Similar Demographics by 9th Grade
Demographics Similar to Salvadorans by 9th Grade
In terms of 9th grade, the demographic groups most similar to Salvadorans are Immigrants from Guatemala (89.4%, a difference of 0.20%), Guatemalan (89.9%, a difference of 0.31%), Mexican (90.0%, a difference of 0.43%), Yakama (90.1%, a difference of 0.49%), and Immigrants from El Salvador (89.0%, a difference of 0.71%).
| Demographics | Rating | Rank | 9th Grade |
| Immigrants | Yemen | 0.0 /100 | #333 | Tragic 90.8% |
| Immigrants | Azores | 0.0 /100 | #334 | Tragic 90.8% |
| Immigrants | Honduras | 0.0 /100 | #335 | Tragic 90.6% |
| Immigrants | Dominican Republic | 0.0 /100 | #336 | Tragic 90.5% |
| Immigrants | Latin America | 0.0 /100 | #337 | Tragic 90.4% |
| Central Americans | 0.0 /100 | #338 | Tragic 90.4% |
| Yakama | 0.0 /100 | #339 | Tragic 90.1% |
| Mexicans | 0.0 /100 | #340 | Tragic 90.0% |
| Guatemalans | 0.0 /100 | #341 | Tragic 89.9% |
| Salvadorans | 0.0 /100 | #342 | Tragic 89.6% |
| Immigrants | Guatemala | 0.0 /100 | #343 | Tragic 89.4% |
| Immigrants | El Salvador | 0.0 /100 | #344 | Tragic 89.0% |
| Immigrants | Central America | 0.0 /100 | #345 | Tragic 89.0% |
| Immigrants | Mexico | 0.0 /100 | #346 | Tragic 88.7% |
| Spanish American Indians | 0.0 /100 | #347 | Tragic 88.3% |
Demographics Similar to Crow by 9th Grade
In terms of 9th grade, the demographic groups most similar to Crow are Immigrants from India (96.1%, a difference of 0.0%), Alaska Native (96.1%, a difference of 0.010%), Russian (96.0%, a difference of 0.010%), Australian (96.0%, a difference of 0.010%), and Greek (96.0%, a difference of 0.020%).
| Demographics | Rating | Rank | 9th Grade |
| Immigrants | Scotland | 99.9 /100 | #38 | Exceptional 96.1% |
| Ottawa | 99.9 /100 | #39 | Exceptional 96.1% |
| Slavs | 99.9 /100 | #40 | Exceptional 96.1% |
| Czechoslovakians | 99.9 /100 | #41 | Exceptional 96.1% |
| Chippewa | 99.9 /100 | #42 | Exceptional 96.1% |
| Iranians | 99.9 /100 | #43 | Exceptional 96.1% |
| Alaska Natives | 99.9 /100 | #44 | Exceptional 96.1% |
| Crow | 99.9 /100 | #45 | Exceptional 96.1% |
| Immigrants | India | 99.9 /100 | #46 | Exceptional 96.1% |
| Russians | 99.9 /100 | #47 | Exceptional 96.0% |
| Australians | 99.9 /100 | #48 | Exceptional 96.0% |
| Greeks | 99.9 /100 | #49 | Exceptional 96.0% |
| Celtics | 99.9 /100 | #50 | Exceptional 96.0% |
| Immigrants | Northern Europe | 99.9 /100 | #51 | Exceptional 96.0% |
| Serbians | 99.9 /100 | #52 | Exceptional 96.0% |