Russian vs Hispanic or Latino Female Poverty
COMPARE
Russian
Hispanic or Latino
Female Poverty
Female Poverty Comparison
Russians
Hispanics or Latinos
11.8%
FEMALE POVERTY
99.3/ 100
METRIC RATING
38th/ 347
METRIC RANK
16.6%
FEMALE POVERTY
0.0/ 100
METRIC RATING
299th/ 347
METRIC RANK
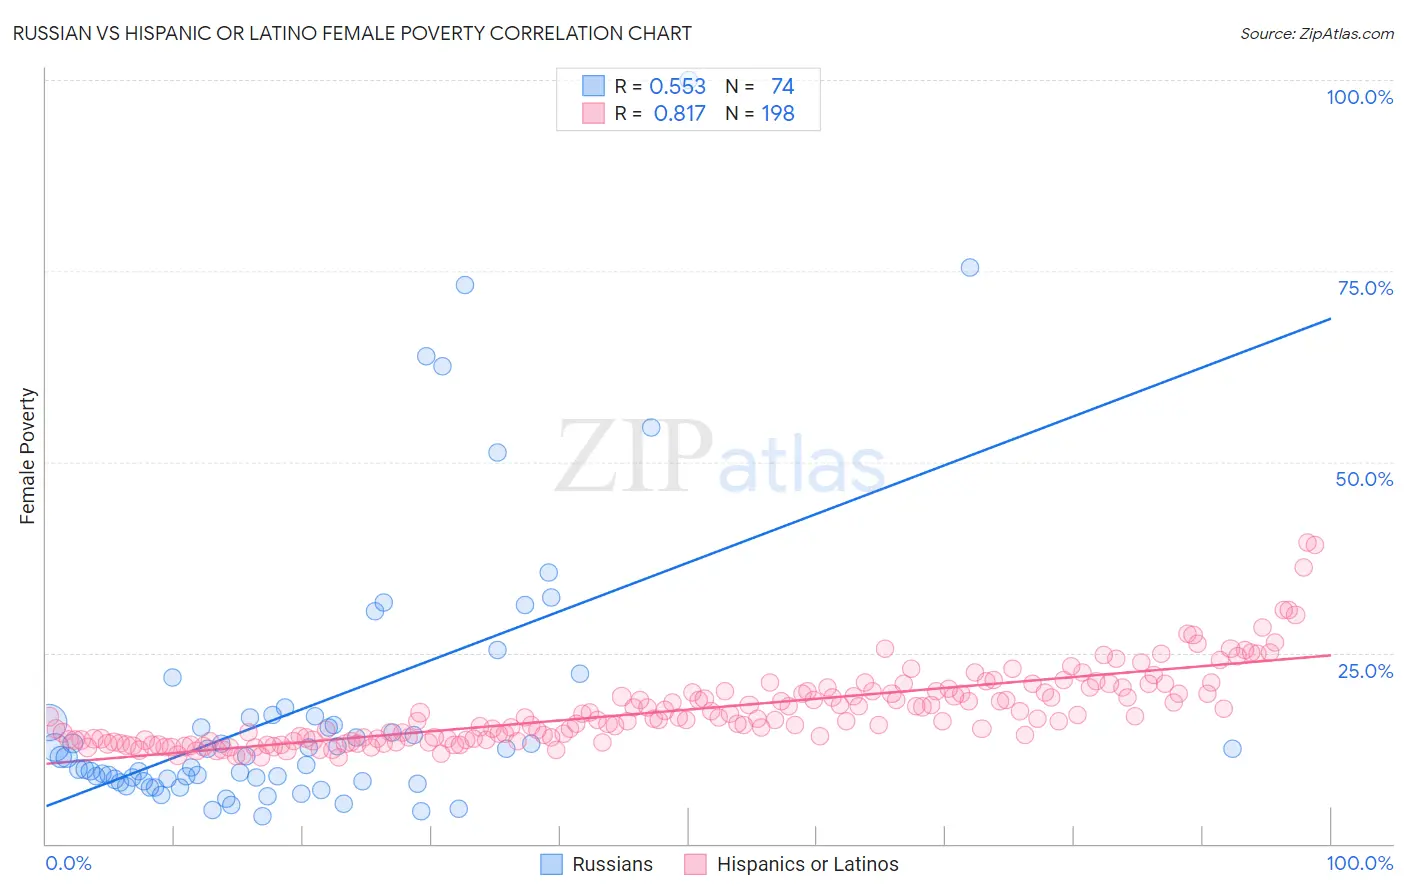
Russian vs Hispanic or Latino Female Poverty Correlation Chart
The statistical analysis conducted on geographies consisting of 511,408,549 people shows a substantial positive correlation between the proportion of Russians and poverty level among females in the United States with a correlation coefficient (R) of 0.553 and weighted average of 11.8%. Similarly, the statistical analysis conducted on geographies consisting of 574,030,648 people shows a very strong positive correlation between the proportion of Hispanics or Latinos and poverty level among females in the United States with a correlation coefficient (R) of 0.817 and weighted average of 16.6%, a difference of 40.8%.
Female Poverty Correlation Summary
| Measurement | Russian | Hispanic or Latino |
| Minimum | 3.6% | 11.3% |
| Maximum | 100.0% | 39.4% |
| Range | 96.4% | 28.1% |
| Mean | 17.7% | 17.5% |
| Median | 11.4% | 16.3% |
| Interquartile 25% (IQ1) | 8.2% | 13.6% |
| Interquartile 75% (IQ3) | 16.5% | 19.8% |
| Interquartile Range (IQR) | 8.2% | 6.2% |
| Standard Deviation (Sample) | 18.5% | 5.0% |
| Standard Deviation (Population) | 18.4% | 5.0% |
Similar Demographics by Female Poverty
Demographics Similar to Russians by Female Poverty
In terms of female poverty, the demographic groups most similar to Russians are Immigrants from Greece (11.8%, a difference of 0.020%), Immigrants from Pakistan (11.8%, a difference of 0.11%), Immigrants from Poland (11.8%, a difference of 0.21%), Macedonian (11.8%, a difference of 0.26%), and Immigrants from Iran (11.8%, a difference of 0.28%).
| Demographics | Rating | Rank | Female Poverty |
| Poles | 99.5 /100 | #31 | Exceptional 11.7% |
| Danes | 99.5 /100 | #32 | Exceptional 11.7% |
| Cypriots | 99.5 /100 | #33 | Exceptional 11.8% |
| Immigrants | Singapore | 99.4 /100 | #34 | Exceptional 11.8% |
| Immigrants | Iran | 99.4 /100 | #35 | Exceptional 11.8% |
| Immigrants | Pakistan | 99.4 /100 | #36 | Exceptional 11.8% |
| Immigrants | Greece | 99.3 /100 | #37 | Exceptional 11.8% |
| Russians | 99.3 /100 | #38 | Exceptional 11.8% |
| Immigrants | Poland | 99.3 /100 | #39 | Exceptional 11.8% |
| Macedonians | 99.3 /100 | #40 | Exceptional 11.8% |
| Czechs | 99.2 /100 | #41 | Exceptional 11.9% |
| Immigrants | Moldova | 99.2 /100 | #42 | Exceptional 11.9% |
| Koreans | 99.2 /100 | #43 | Exceptional 11.9% |
| Tongans | 99.2 /100 | #44 | Exceptional 11.9% |
| Immigrants | Czechoslovakia | 99.2 /100 | #45 | Exceptional 11.9% |
Demographics Similar to Hispanics or Latinos by Female Poverty
In terms of female poverty, the demographic groups most similar to Hispanics or Latinos are Bahamian (16.6%, a difference of 0.040%), Guatemalan (16.7%, a difference of 0.38%), Chippewa (16.7%, a difference of 0.40%), Somali (16.6%, a difference of 0.52%), and Mexican (16.5%, a difference of 0.73%).
| Demographics | Rating | Rank | Female Poverty |
| Immigrants | Zaire | 0.0 /100 | #292 | Tragic 16.4% |
| Immigrants | Latin America | 0.0 /100 | #293 | Tragic 16.4% |
| Immigrants | Cabo Verde | 0.0 /100 | #294 | Tragic 16.4% |
| Senegalese | 0.0 /100 | #295 | Tragic 16.5% |
| Immigrants | Senegal | 0.0 /100 | #296 | Tragic 16.5% |
| Mexicans | 0.0 /100 | #297 | Tragic 16.5% |
| Somalis | 0.0 /100 | #298 | Tragic 16.6% |
| Hispanics or Latinos | 0.0 /100 | #299 | Tragic 16.6% |
| Bahamians | 0.0 /100 | #300 | Tragic 16.6% |
| Guatemalans | 0.0 /100 | #301 | Tragic 16.7% |
| Chippewa | 0.0 /100 | #302 | Tragic 16.7% |
| Choctaw | 0.0 /100 | #303 | Tragic 16.8% |
| Immigrants | Central America | 0.0 /100 | #304 | Tragic 16.8% |
| Immigrants | Grenada | 0.0 /100 | #305 | Tragic 16.8% |
| Immigrants | Caribbean | 0.0 /100 | #306 | Tragic 16.9% |