Romanian vs Immigrants from Korea Child Poverty Among Girls Under 16
COMPARE
Romanian
Immigrants from Korea
Child Poverty Among Girls Under 16
Child Poverty Among Girls Under 16 Comparison
Romanians
Immigrants from Korea
15.0%
CHILD POVERTY AMONG GIRLS UNDER 16
95.3/ 100
METRIC RATING
104th/ 347
METRIC RANK
13.1%
CHILD POVERTY AMONG GIRLS UNDER 16
99.9/ 100
METRIC RATING
18th/ 347
METRIC RANK
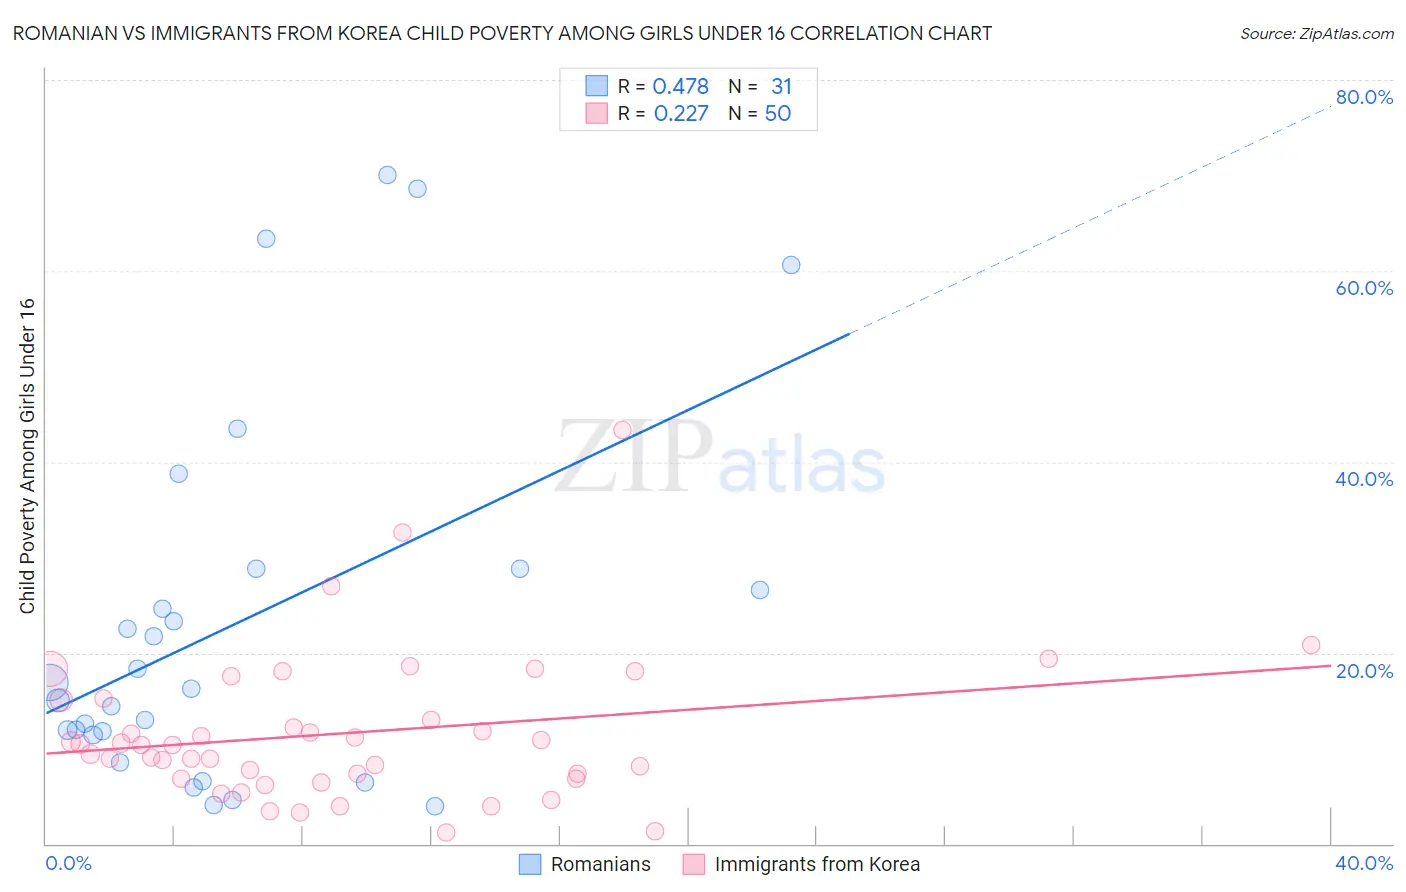
Romanian vs Immigrants from Korea Child Poverty Among Girls Under 16 Correlation Chart
The statistical analysis conducted on geographies consisting of 369,938,935 people shows a moderate positive correlation between the proportion of Romanians and poverty level among girls under the age of 16 in the United States with a correlation coefficient (R) of 0.478 and weighted average of 15.0%. Similarly, the statistical analysis conducted on geographies consisting of 407,349,418 people shows a weak positive correlation between the proportion of Immigrants from Korea and poverty level among girls under the age of 16 in the United States with a correlation coefficient (R) of 0.227 and weighted average of 13.1%, a difference of 14.4%.
Child Poverty Among Girls Under 16 Correlation Summary
| Measurement | Romanian | Immigrants from Korea |
| Minimum | 4.0% | 1.2% |
| Maximum | 70.0% | 43.4% |
| Range | 66.0% | 42.2% |
| Mean | 23.0% | 11.6% |
| Median | 16.3% | 10.4% |
| Interquartile 25% (IQ1) | 11.4% | 6.9% |
| Interquartile 75% (IQ3) | 28.8% | 15.1% |
| Interquartile Range (IQR) | 17.5% | 8.2% |
| Standard Deviation (Sample) | 19.3% | 7.8% |
| Standard Deviation (Population) | 19.0% | 7.7% |
Similar Demographics by Child Poverty Among Girls Under 16
Demographics Similar to Romanians by Child Poverty Among Girls Under 16
In terms of child poverty among girls under 16, the demographic groups most similar to Romanians are Immigrants from England (15.1%, a difference of 0.14%), Chilean (15.1%, a difference of 0.15%), British (15.0%, a difference of 0.16%), Immigrants from Malaysia (15.0%, a difference of 0.18%), and Immigrants from South Africa (15.0%, a difference of 0.19%).
| Demographics | Rating | Rank | Child Poverty Among Girls Under 16 |
| Immigrants | Latvia | 96.1 /100 | #97 | Exceptional 14.9% |
| Basques | 95.9 /100 | #98 | Exceptional 15.0% |
| Immigrants | Egypt | 95.7 /100 | #99 | Exceptional 15.0% |
| Paraguayans | 95.7 /100 | #100 | Exceptional 15.0% |
| Immigrants | South Africa | 95.6 /100 | #101 | Exceptional 15.0% |
| Immigrants | Malaysia | 95.6 /100 | #102 | Exceptional 15.0% |
| British | 95.6 /100 | #103 | Exceptional 15.0% |
| Romanians | 95.3 /100 | #104 | Exceptional 15.0% |
| Immigrants | England | 95.1 /100 | #105 | Exceptional 15.1% |
| Chileans | 95.1 /100 | #106 | Exceptional 15.1% |
| Immigrants | Ukraine | 95.0 /100 | #107 | Exceptional 15.1% |
| Immigrants | Brazil | 94.9 /100 | #108 | Exceptional 15.1% |
| Serbians | 94.8 /100 | #109 | Exceptional 15.1% |
| Immigrants | Croatia | 94.6 /100 | #110 | Exceptional 15.1% |
| Palestinians | 94.5 /100 | #111 | Exceptional 15.1% |
Demographics Similar to Immigrants from Korea by Child Poverty Among Girls Under 16
In terms of child poverty among girls under 16, the demographic groups most similar to Immigrants from Korea are Bulgarian (13.1%, a difference of 0.020%), Immigrants from Lithuania (13.1%, a difference of 0.10%), Cypriot (13.2%, a difference of 0.37%), Okinawan (13.0%, a difference of 1.0%), and Burmese (13.0%, a difference of 1.0%).
| Demographics | Rating | Rank | Child Poverty Among Girls Under 16 |
| Immigrants | South Central Asia | 100.0 /100 | #11 | Exceptional 12.7% |
| Bhutanese | 100.0 /100 | #12 | Exceptional 12.7% |
| Immigrants | Ireland | 99.9 /100 | #13 | Exceptional 12.9% |
| Burmese | 99.9 /100 | #14 | Exceptional 13.0% |
| Okinawans | 99.9 /100 | #15 | Exceptional 13.0% |
| Immigrants | Lithuania | 99.9 /100 | #16 | Exceptional 13.1% |
| Bulgarians | 99.9 /100 | #17 | Exceptional 13.1% |
| Immigrants | Korea | 99.9 /100 | #18 | Exceptional 13.1% |
| Cypriots | 99.9 /100 | #19 | Exceptional 13.2% |
| Immigrants | Japan | 99.9 /100 | #20 | Exceptional 13.3% |
| Assyrians/Chaldeans/Syriacs | 99.9 /100 | #21 | Exceptional 13.3% |
| Indians (Asian) | 99.9 /100 | #22 | Exceptional 13.3% |
| Norwegians | 99.9 /100 | #23 | Exceptional 13.3% |
| Immigrants | Eastern Asia | 99.9 /100 | #24 | Exceptional 13.4% |
| Immigrants | China | 99.8 /100 | #25 | Exceptional 13.4% |