Romanian vs Carpatho Rusyn Male Poverty
COMPARE
Romanian
Carpatho Rusyn
Male Poverty
Male Poverty Comparison
Romanians
Carpatho Rusyns
10.5%
MALE POVERTY
93.6/ 100
METRIC RATING
97th/ 347
METRIC RANK
10.2%
MALE POVERTY
96.9/ 100
METRIC RATING
75th/ 347
METRIC RANK
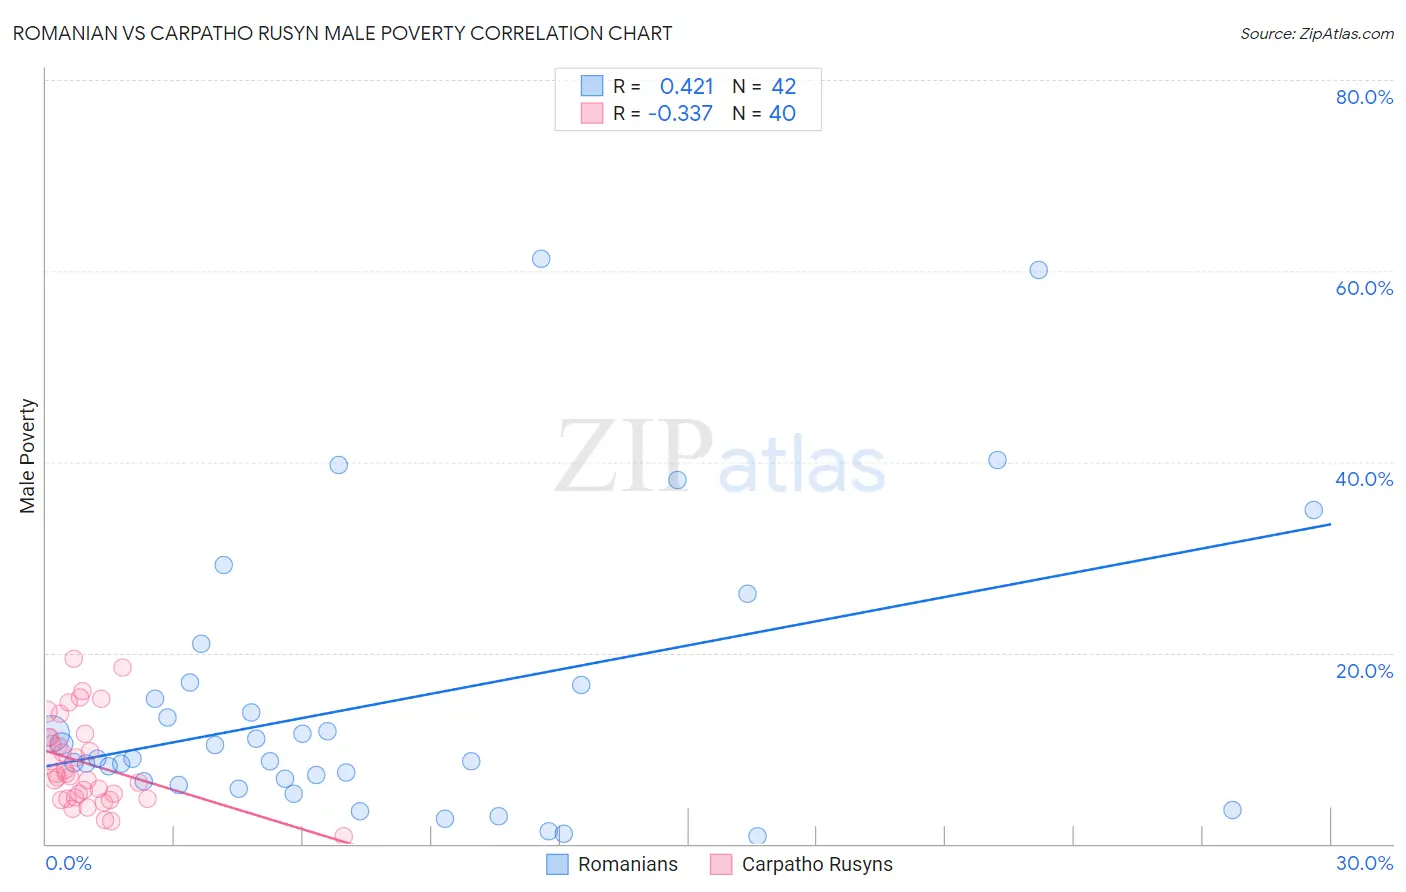
Romanian vs Carpatho Rusyn Male Poverty Correlation Chart
The statistical analysis conducted on geographies consisting of 377,566,833 people shows a moderate positive correlation between the proportion of Romanians and poverty level among males in the United States with a correlation coefficient (R) of 0.421 and weighted average of 10.5%. Similarly, the statistical analysis conducted on geographies consisting of 58,868,147 people shows a mild negative correlation between the proportion of Carpatho Rusyns and poverty level among males in the United States with a correlation coefficient (R) of -0.337 and weighted average of 10.2%, a difference of 2.0%.
Male Poverty Correlation Summary
| Measurement | Romanian | Carpatho Rusyn |
| Minimum | 0.81% | 0.81% |
| Maximum | 61.3% | 19.4% |
| Range | 60.5% | 18.6% |
| Mean | 14.8% | 8.4% |
| Median | 8.9% | 7.2% |
| Interquartile 25% (IQ1) | 6.5% | 4.8% |
| Interquartile 75% (IQ3) | 16.6% | 11.2% |
| Interquartile Range (IQR) | 10.1% | 6.3% |
| Standard Deviation (Sample) | 14.7% | 4.6% |
| Standard Deviation (Population) | 14.5% | 4.5% |
Similar Demographics by Male Poverty
Demographics Similar to Romanians by Male Poverty
In terms of male poverty, the demographic groups most similar to Romanians are Immigrants from Egypt (10.4%, a difference of 0.050%), Finnish (10.5%, a difference of 0.060%), Immigrants from Indonesia (10.5%, a difference of 0.13%), Scottish (10.4%, a difference of 0.18%), and Immigrants from South Africa (10.4%, a difference of 0.22%).
| Demographics | Rating | Rank | Male Poverty |
| Indians (Asian) | 94.9 /100 | #90 | Exceptional 10.4% |
| British | 94.8 /100 | #91 | Exceptional 10.4% |
| Jordanians | 94.4 /100 | #92 | Exceptional 10.4% |
| Australians | 94.4 /100 | #93 | Exceptional 10.4% |
| Immigrants | South Africa | 94.1 /100 | #94 | Exceptional 10.4% |
| Scottish | 94.0 /100 | #95 | Exceptional 10.4% |
| Immigrants | Egypt | 93.7 /100 | #96 | Exceptional 10.4% |
| Romanians | 93.6 /100 | #97 | Exceptional 10.5% |
| Finns | 93.4 /100 | #98 | Exceptional 10.5% |
| Immigrants | Indonesia | 93.3 /100 | #99 | Exceptional 10.5% |
| Immigrants | Latvia | 92.8 /100 | #100 | Exceptional 10.5% |
| Immigrants | Zimbabwe | 92.0 /100 | #101 | Exceptional 10.5% |
| French Canadians | 91.9 /100 | #102 | Exceptional 10.5% |
| Slavs | 91.7 /100 | #103 | Exceptional 10.5% |
| Welsh | 91.6 /100 | #104 | Exceptional 10.5% |
Demographics Similar to Carpatho Rusyns by Male Poverty
In terms of male poverty, the demographic groups most similar to Carpatho Rusyns are Immigrants from Eastern Europe (10.2%, a difference of 0.0%), Dutch (10.2%, a difference of 0.010%), Immigrants from Belgium (10.3%, a difference of 0.040%), Irish (10.3%, a difference of 0.060%), and Immigrants from Asia (10.2%, a difference of 0.080%).
| Demographics | Rating | Rank | Male Poverty |
| Immigrants | Sri Lanka | 97.2 /100 | #68 | Exceptional 10.2% |
| Immigrants | Australia | 97.1 /100 | #69 | Exceptional 10.2% |
| Paraguayans | 97.1 /100 | #70 | Exceptional 10.2% |
| Europeans | 97.1 /100 | #71 | Exceptional 10.2% |
| Immigrants | Canada | 97.1 /100 | #72 | Exceptional 10.2% |
| Immigrants | Asia | 97.0 /100 | #73 | Exceptional 10.2% |
| Immigrants | Eastern Europe | 96.9 /100 | #74 | Exceptional 10.2% |
| Carpatho Rusyns | 96.9 /100 | #75 | Exceptional 10.2% |
| Dutch | 96.9 /100 | #76 | Exceptional 10.2% |
| Immigrants | Belgium | 96.8 /100 | #77 | Exceptional 10.3% |
| Irish | 96.8 /100 | #78 | Exceptional 10.3% |
| Immigrants | North America | 96.5 /100 | #79 | Exceptional 10.3% |
| English | 96.4 /100 | #80 | Exceptional 10.3% |
| Belgians | 95.9 /100 | #81 | Exceptional 10.3% |
| Egyptians | 95.9 /100 | #82 | Exceptional 10.3% |