Romanian vs Ethiopian Disability Age Under 5
COMPARE
Romanian
Ethiopian
Disability Age Under 5
Disability Age Under 5 Comparison
Romanians
Ethiopians
1.3%
DISABILITY AGE UNDER 5
22.5/ 100
METRIC RATING
205th/ 347
METRIC RANK
1.1%
DISABILITY AGE UNDER 5
97.2/ 100
METRIC RATING
89th/ 347
METRIC RANK
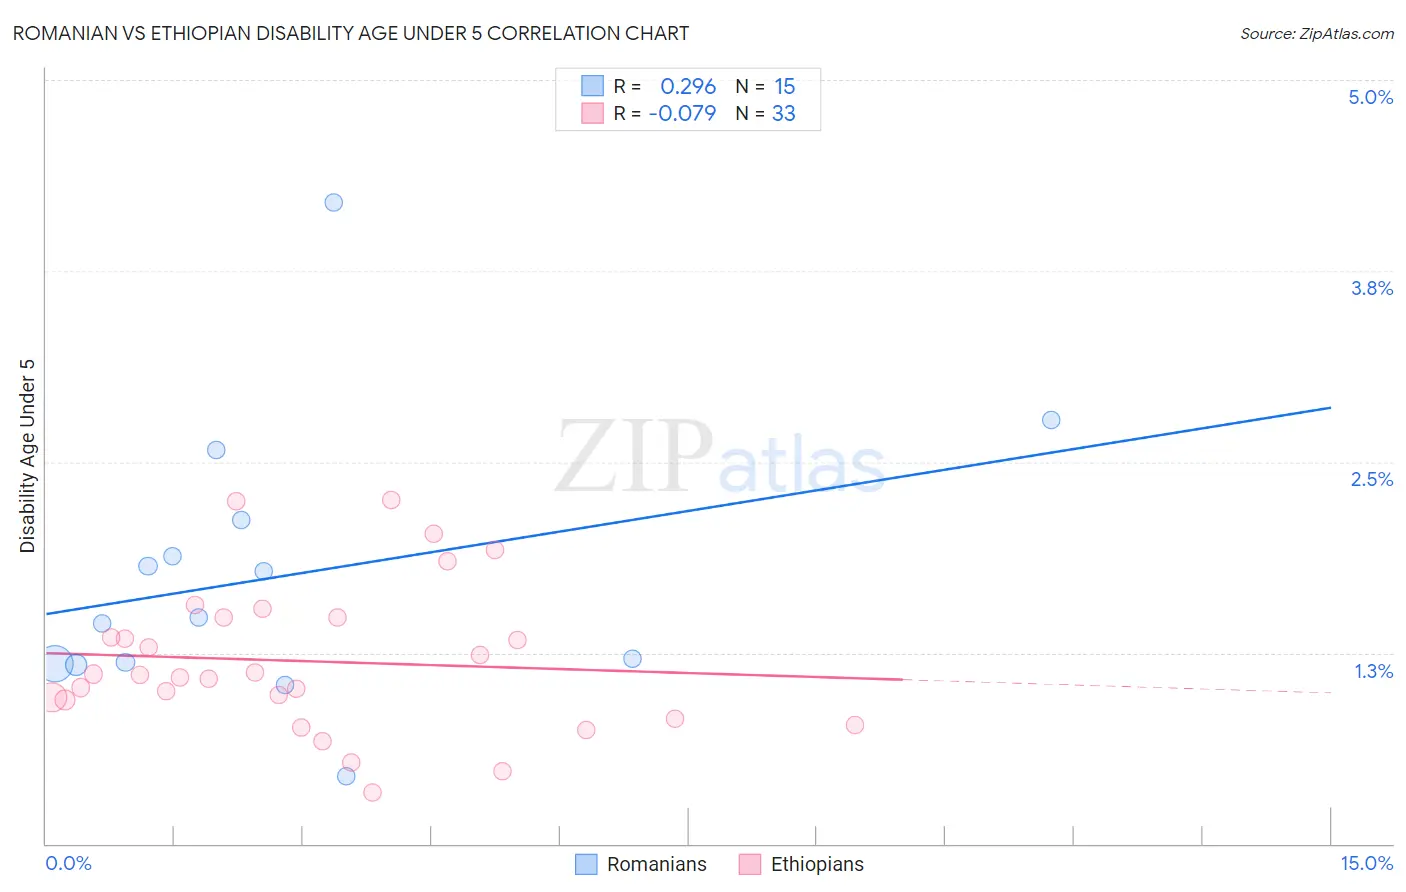
Romanian vs Ethiopian Disability Age Under 5 Correlation Chart
The statistical analysis conducted on geographies consisting of 204,318,414 people shows a weak positive correlation between the proportion of Romanians and percentage of population with a disability under the age of 5 in the United States with a correlation coefficient (R) of 0.296 and weighted average of 1.3%. Similarly, the statistical analysis conducted on geographies consisting of 145,731,727 people shows a slight negative correlation between the proportion of Ethiopians and percentage of population with a disability under the age of 5 in the United States with a correlation coefficient (R) of -0.079 and weighted average of 1.1%, a difference of 11.8%.
Disability Age Under 5 Correlation Summary
| Measurement | Romanian | Ethiopian |
| Minimum | 0.44% | 0.34% |
| Maximum | 4.2% | 2.3% |
| Range | 3.8% | 1.9% |
| Mean | 1.8% | 1.2% |
| Median | 1.5% | 1.1% |
| Interquartile 25% (IQ1) | 1.2% | 0.88% |
| Interquartile 75% (IQ3) | 2.1% | 1.5% |
| Interquartile Range (IQR) | 0.94% | 0.60% |
| Standard Deviation (Sample) | 0.91% | 0.48% |
| Standard Deviation (Population) | 0.88% | 0.47% |
Similar Demographics by Disability Age Under 5
Demographics Similar to Romanians by Disability Age Under 5
In terms of disability age under 5, the demographic groups most similar to Romanians are Immigrants from Poland (1.3%, a difference of 0.020%), Immigrants from Europe (1.3%, a difference of 0.14%), Nigerian (1.3%, a difference of 0.17%), Liberian (1.3%, a difference of 0.18%), and Arapaho (1.3%, a difference of 0.20%).
| Demographics | Rating | Rank | Disability Age Under 5 |
| Immigrants | Norway | 31.1 /100 | #198 | Fair 1.3% |
| Jamaicans | 30.7 /100 | #199 | Fair 1.3% |
| Immigrants | Lithuania | 27.2 /100 | #200 | Fair 1.3% |
| Immigrants | Italy | 25.4 /100 | #201 | Fair 1.3% |
| Arapaho | 24.1 /100 | #202 | Fair 1.3% |
| Liberians | 24.0 /100 | #203 | Fair 1.3% |
| Immigrants | Europe | 23.6 /100 | #204 | Fair 1.3% |
| Romanians | 22.5 /100 | #205 | Fair 1.3% |
| Immigrants | Poland | 22.4 /100 | #206 | Fair 1.3% |
| Nigerians | 21.2 /100 | #207 | Fair 1.3% |
| Mexicans | 20.8 /100 | #208 | Fair 1.3% |
| Bulgarians | 19.5 /100 | #209 | Poor 1.3% |
| Pakistanis | 19.4 /100 | #210 | Poor 1.3% |
| Immigrants | Greece | 19.1 /100 | #211 | Poor 1.3% |
| Chileans | 18.8 /100 | #212 | Poor 1.3% |
Demographics Similar to Ethiopians by Disability Age Under 5
In terms of disability age under 5, the demographic groups most similar to Ethiopians are Chinese (1.1%, a difference of 0.030%), Albanian (1.1%, a difference of 0.070%), Immigrants from Cuba (1.1%, a difference of 0.24%), Spanish American (1.1%, a difference of 0.27%), and Immigrants from Dominican Republic (1.1%, a difference of 0.28%).
| Demographics | Rating | Rank | Disability Age Under 5 |
| Immigrants | Jordan | 97.9 /100 | #82 | Exceptional 1.1% |
| Immigrants | Syria | 97.9 /100 | #83 | Exceptional 1.1% |
| Immigrants | Zaire | 97.8 /100 | #84 | Exceptional 1.1% |
| Sudanese | 97.7 /100 | #85 | Exceptional 1.1% |
| Okinawans | 97.6 /100 | #86 | Exceptional 1.1% |
| Ugandans | 97.5 /100 | #87 | Exceptional 1.1% |
| Immigrants | Dominican Republic | 97.5 /100 | #88 | Exceptional 1.1% |
| Ethiopians | 97.2 /100 | #89 | Exceptional 1.1% |
| Chinese | 97.2 /100 | #90 | Exceptional 1.1% |
| Albanians | 97.2 /100 | #91 | Exceptional 1.1% |
| Immigrants | Cuba | 97.0 /100 | #92 | Exceptional 1.1% |
| Spanish Americans | 96.9 /100 | #93 | Exceptional 1.1% |
| Sri Lankans | 96.8 /100 | #94 | Exceptional 1.1% |
| Immigrants | Moldova | 96.8 /100 | #95 | Exceptional 1.1% |
| Mongolians | 96.6 /100 | #96 | Exceptional 1.1% |