Puget Sound Salish vs Macedonian 11th Grade
COMPARE
Puget Sound Salish
Macedonian
11th Grade
11th Grade Comparison
Puget Sound Salish
Macedonians
93.6%
11TH GRADE
99.1/ 100
METRIC RATING
93rd/ 347
METRIC RANK
94.1%
11TH GRADE
99.9/ 100
METRIC RATING
48th/ 347
METRIC RANK
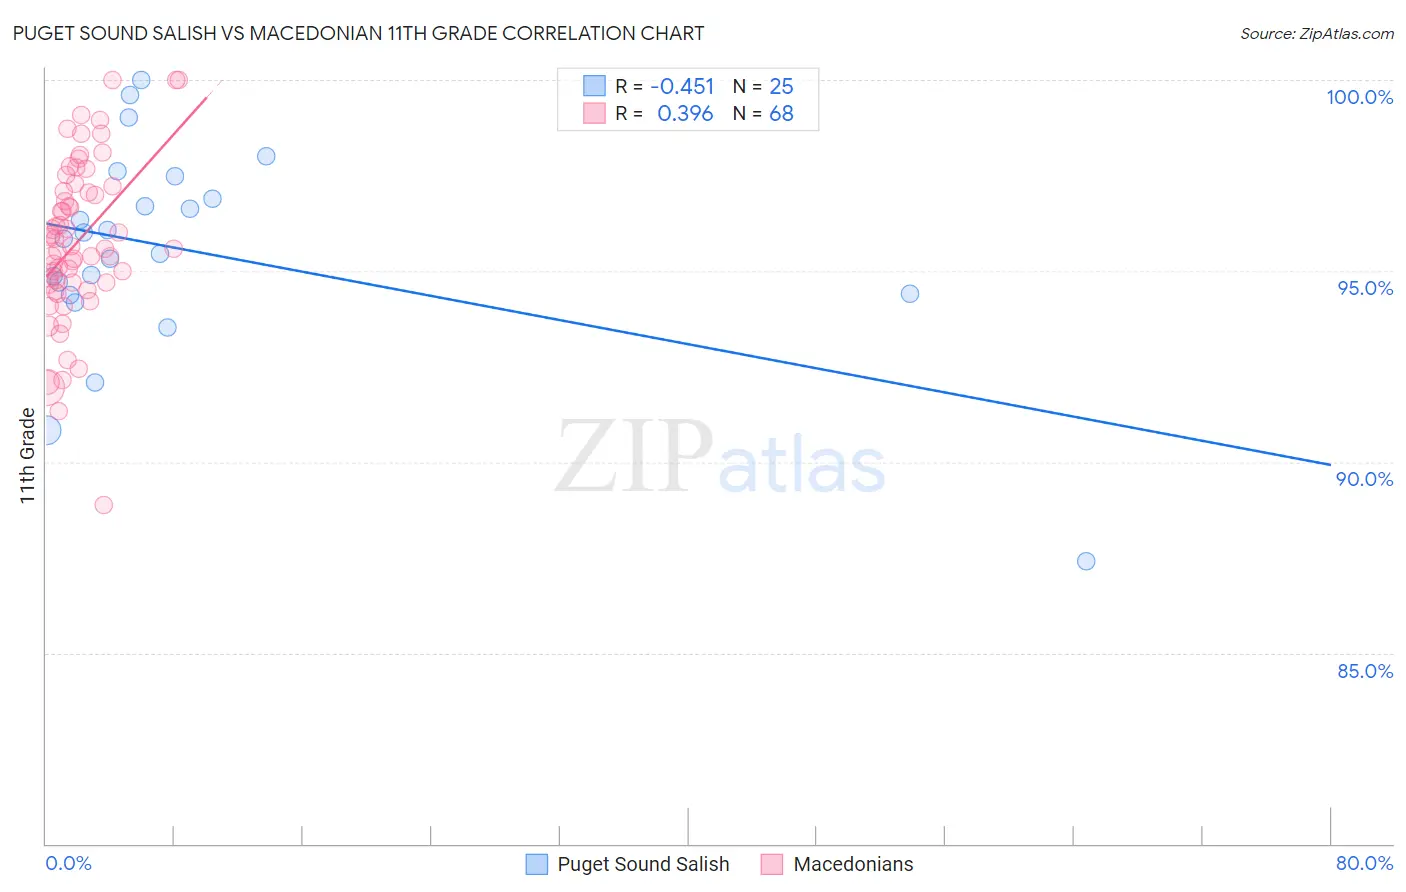
Puget Sound Salish vs Macedonian 11th Grade Correlation Chart
The statistical analysis conducted on geographies consisting of 46,155,775 people shows a moderate negative correlation between the proportion of Puget Sound Salish and percentage of population with at least 11th grade education in the United States with a correlation coefficient (R) of -0.451 and weighted average of 93.6%. Similarly, the statistical analysis conducted on geographies consisting of 132,646,607 people shows a mild positive correlation between the proportion of Macedonians and percentage of population with at least 11th grade education in the United States with a correlation coefficient (R) of 0.396 and weighted average of 94.1%, a difference of 0.52%.
11th Grade Correlation Summary
| Measurement | Puget Sound Salish | Macedonian |
| Minimum | 87.4% | 88.9% |
| Maximum | 100.0% | 100.0% |
| Range | 12.6% | 11.1% |
| Mean | 95.5% | 95.8% |
| Median | 95.8% | 95.6% |
| Interquartile 25% (IQ1) | 94.4% | 94.7% |
| Interquartile 75% (IQ3) | 97.2% | 97.1% |
| Interquartile Range (IQR) | 2.8% | 2.5% |
| Standard Deviation (Sample) | 2.7% | 2.2% |
| Standard Deviation (Population) | 2.7% | 2.1% |
Similar Demographics by 11th Grade
Demographics Similar to Puget Sound Salish by 11th Grade
In terms of 11th grade, the demographic groups most similar to Puget Sound Salish are Immigrants from Bulgaria (93.6%, a difference of 0.020%), Swiss (93.6%, a difference of 0.020%), Immigrants from France (93.6%, a difference of 0.020%), South African (93.6%, a difference of 0.030%), and Ottawa (93.6%, a difference of 0.040%).
| Demographics | Rating | Rank | 11th Grade |
| Immigrants | South Central Asia | 99.2 /100 | #86 | Exceptional 93.6% |
| Immigrants | Western Europe | 99.2 /100 | #87 | Exceptional 93.6% |
| Cambodians | 99.2 /100 | #88 | Exceptional 93.6% |
| Burmese | 99.2 /100 | #89 | Exceptional 93.6% |
| Ottawa | 99.2 /100 | #90 | Exceptional 93.6% |
| South Africans | 99.2 /100 | #91 | Exceptional 93.6% |
| Immigrants | Bulgaria | 99.1 /100 | #92 | Exceptional 93.6% |
| Puget Sound Salish | 99.1 /100 | #93 | Exceptional 93.6% |
| Swiss | 99.0 /100 | #94 | Exceptional 93.6% |
| Immigrants | France | 99.0 /100 | #95 | Exceptional 93.6% |
| Immigrants | Turkey | 98.9 /100 | #96 | Exceptional 93.5% |
| Immigrants | Iran | 98.9 /100 | #97 | Exceptional 93.5% |
| Immigrants | Israel | 98.8 /100 | #98 | Exceptional 93.5% |
| Menominee | 98.7 /100 | #99 | Exceptional 93.5% |
| Immigrants | North Macedonia | 98.7 /100 | #100 | Exceptional 93.5% |
Demographics Similar to Macedonians by 11th Grade
In terms of 11th grade, the demographic groups most similar to Macedonians are Filipino (94.1%, a difference of 0.0%), Slavic (94.1%, a difference of 0.0%), French (94.1%, a difference of 0.0%), Serbian (94.1%, a difference of 0.010%), and Australian (94.1%, a difference of 0.020%).
| Demographics | Rating | Rank | 11th Grade |
| Cypriots | 99.9 /100 | #41 | Exceptional 94.1% |
| Immigrants | Austria | 99.9 /100 | #42 | Exceptional 94.1% |
| Greeks | 99.9 /100 | #43 | Exceptional 94.1% |
| Immigrants | Ireland | 99.9 /100 | #44 | Exceptional 94.1% |
| Australians | 99.9 /100 | #45 | Exceptional 94.1% |
| Serbians | 99.9 /100 | #46 | Exceptional 94.1% |
| Filipinos | 99.9 /100 | #47 | Exceptional 94.1% |
| Macedonians | 99.9 /100 | #48 | Exceptional 94.1% |
| Slavs | 99.9 /100 | #49 | Exceptional 94.1% |
| French | 99.9 /100 | #50 | Exceptional 94.1% |
| Turks | 99.9 /100 | #51 | Exceptional 94.0% |
| Immigrants | Canada | 99.9 /100 | #52 | Exceptional 94.0% |
| Immigrants | Australia | 99.9 /100 | #53 | Exceptional 94.0% |
| Immigrants | North America | 99.9 /100 | #54 | Exceptional 94.0% |
| Czechoslovakians | 99.9 /100 | #55 | Exceptional 94.0% |