Immigrants from Guyana vs Macedonian Male Poverty
COMPARE
Immigrants from Guyana
Macedonian
Male Poverty
Male Poverty Comparison
Immigrants from Guyana
Macedonians
13.2%
MALE POVERTY
0.1/ 100
METRIC RATING
266th/ 347
METRIC RANK
9.7%
MALE POVERTY
99.5/ 100
METRIC RATING
32nd/ 347
METRIC RANK
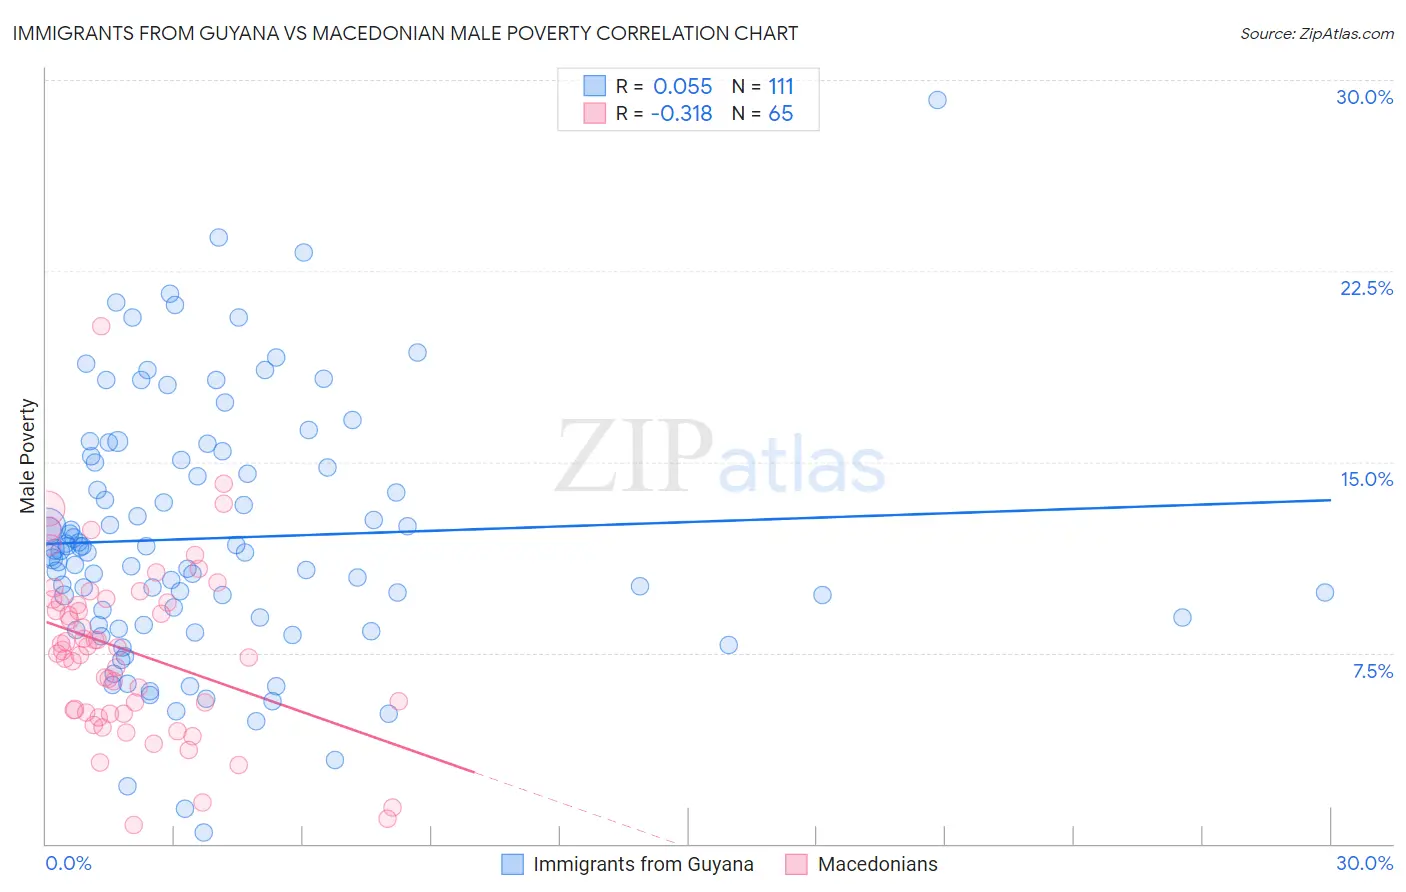
Immigrants from Guyana vs Macedonian Male Poverty Correlation Chart
The statistical analysis conducted on geographies consisting of 183,559,274 people shows a slight positive correlation between the proportion of Immigrants from Guyana and poverty level among males in the United States with a correlation coefficient (R) of 0.055 and weighted average of 13.2%. Similarly, the statistical analysis conducted on geographies consisting of 132,583,851 people shows a mild negative correlation between the proportion of Macedonians and poverty level among males in the United States with a correlation coefficient (R) of -0.318 and weighted average of 9.7%, a difference of 35.9%.
Male Poverty Correlation Summary
| Measurement | Immigrants from Guyana | Macedonian |
| Minimum | 0.44% | 0.75% |
| Maximum | 29.2% | 20.3% |
| Range | 28.8% | 19.6% |
| Mean | 12.0% | 7.6% |
| Median | 11.4% | 7.6% |
| Interquartile 25% (IQ1) | 8.6% | 5.1% |
| Interquartile 75% (IQ3) | 15.1% | 9.5% |
| Interquartile Range (IQR) | 6.5% | 4.4% |
| Standard Deviation (Sample) | 5.0% | 3.4% |
| Standard Deviation (Population) | 5.0% | 3.4% |
Similar Demographics by Male Poverty
Demographics Similar to Immigrants from Guyana by Male Poverty
In terms of male poverty, the demographic groups most similar to Immigrants from Guyana are Immigrants from Jamaica (13.3%, a difference of 0.11%), Jamaican (13.2%, a difference of 0.14%), Subsaharan African (13.3%, a difference of 0.14%), Iroquois (13.2%, a difference of 0.16%), and Guyanese (13.3%, a difference of 0.36%).
| Demographics | Rating | Rank | Male Poverty |
| Cherokee | 0.1 /100 | #259 | Tragic 13.1% |
| Ottawa | 0.1 /100 | #260 | Tragic 13.1% |
| Trinidadians and Tobagonians | 0.1 /100 | #261 | Tragic 13.1% |
| Spanish American Indians | 0.1 /100 | #262 | Tragic 13.1% |
| Central Americans | 0.1 /100 | #263 | Tragic 13.2% |
| Iroquois | 0.1 /100 | #264 | Tragic 13.2% |
| Jamaicans | 0.1 /100 | #265 | Tragic 13.2% |
| Immigrants | Guyana | 0.1 /100 | #266 | Tragic 13.2% |
| Immigrants | Jamaica | 0.1 /100 | #267 | Tragic 13.3% |
| Sub-Saharan Africans | 0.1 /100 | #268 | Tragic 13.3% |
| Guyanese | 0.0 /100 | #269 | Tragic 13.3% |
| Cree | 0.0 /100 | #270 | Tragic 13.3% |
| Spanish Americans | 0.0 /100 | #271 | Tragic 13.4% |
| Immigrants | Bahamas | 0.0 /100 | #272 | Tragic 13.5% |
| Chickasaw | 0.0 /100 | #273 | Tragic 13.5% |
Demographics Similar to Macedonians by Male Poverty
In terms of male poverty, the demographic groups most similar to Macedonians are Immigrants from Northern Europe (9.7%, a difference of 0.090%), Tongan (9.7%, a difference of 0.21%), Polish (9.7%, a difference of 0.23%), Immigrants from Poland (9.8%, a difference of 0.23%), and Greek (9.7%, a difference of 0.30%).
| Demographics | Rating | Rank | Male Poverty |
| Eastern Europeans | 99.6 /100 | #25 | Exceptional 9.6% |
| Burmese | 99.6 /100 | #26 | Exceptional 9.7% |
| Danes | 99.6 /100 | #27 | Exceptional 9.7% |
| Immigrants | Korea | 99.6 /100 | #28 | Exceptional 9.7% |
| Greeks | 99.6 /100 | #29 | Exceptional 9.7% |
| Poles | 99.5 /100 | #30 | Exceptional 9.7% |
| Tongans | 99.5 /100 | #31 | Exceptional 9.7% |
| Macedonians | 99.5 /100 | #32 | Exceptional 9.7% |
| Immigrants | Northern Europe | 99.5 /100 | #33 | Exceptional 9.7% |
| Immigrants | Poland | 99.5 /100 | #34 | Exceptional 9.8% |
| Iranians | 99.4 /100 | #35 | Exceptional 9.8% |
| Czechs | 99.4 /100 | #36 | Exceptional 9.8% |
| Immigrants | Greece | 99.3 /100 | #37 | Exceptional 9.8% |
| Immigrants | Pakistan | 99.2 /100 | #38 | Exceptional 9.9% |
| Russians | 99.2 /100 | #39 | Exceptional 9.9% |