Puget Sound Salish vs Honduran Family Poverty
COMPARE
Puget Sound Salish
Honduran
Family Poverty
Family Poverty Comparison
Puget Sound Salish
Hondurans
8.4%
FAMILY POVERTY
88.6/ 100
METRIC RATING
131st/ 347
METRIC RANK
12.4%
FAMILY POVERTY
0.0/ 100
METRIC RATING
316th/ 347
METRIC RANK
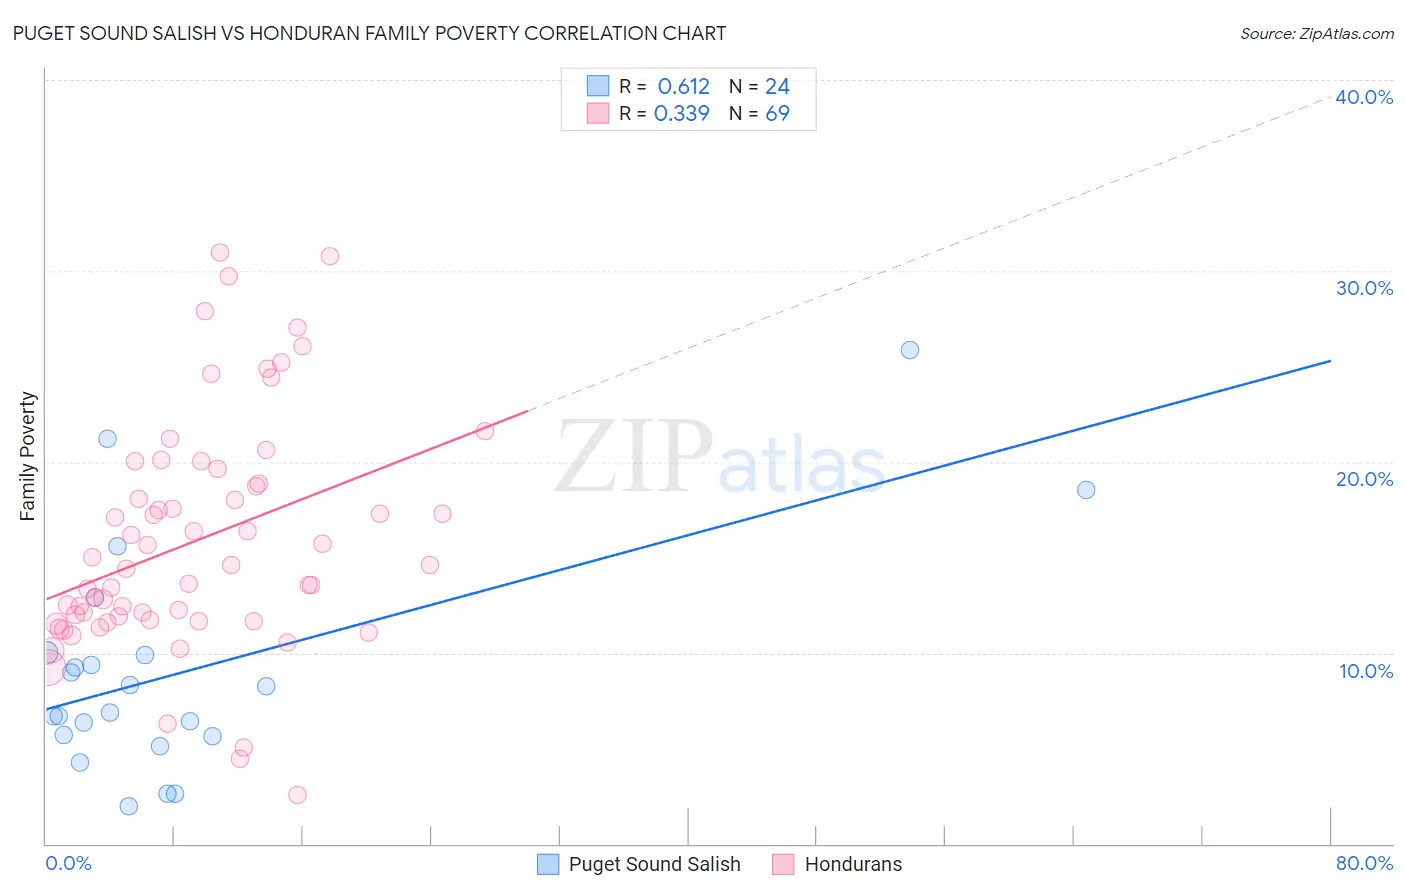
Puget Sound Salish vs Honduran Family Poverty Correlation Chart
The statistical analysis conducted on geographies consisting of 46,127,030 people shows a significant positive correlation between the proportion of Puget Sound Salish and poverty level among families in the United States with a correlation coefficient (R) of 0.612 and weighted average of 8.4%. Similarly, the statistical analysis conducted on geographies consisting of 357,202,991 people shows a mild positive correlation between the proportion of Hondurans and poverty level among families in the United States with a correlation coefficient (R) of 0.339 and weighted average of 12.4%, a difference of 47.2%.
Family Poverty Correlation Summary
| Measurement | Puget Sound Salish | Honduran |
| Minimum | 2.0% | 2.5% |
| Maximum | 25.9% | 31.0% |
| Range | 23.9% | 28.4% |
| Mean | 9.1% | 15.9% |
| Median | 7.6% | 14.6% |
| Interquartile 25% (IQ1) | 5.7% | 11.7% |
| Interquartile 75% (IQ3) | 9.9% | 19.2% |
| Interquartile Range (IQR) | 4.3% | 7.5% |
| Standard Deviation (Sample) | 5.9% | 6.1% |
| Standard Deviation (Population) | 5.8% | 6.1% |
Similar Demographics by Family Poverty
Demographics Similar to Puget Sound Salish by Family Poverty
In terms of family poverty, the demographic groups most similar to Puget Sound Salish are Immigrants from Bosnia and Herzegovina (8.4%, a difference of 0.010%), Immigrants from Argentina (8.4%, a difference of 0.15%), Portuguese (8.4%, a difference of 0.19%), Argentinean (8.4%, a difference of 0.35%), and Immigrants from Hungary (8.4%, a difference of 0.49%).
| Demographics | Rating | Rank | Family Poverty |
| Soviet Union | 90.8 /100 | #124 | Exceptional 8.3% |
| Pakistanis | 90.8 /100 | #125 | Exceptional 8.3% |
| Icelanders | 90.3 /100 | #126 | Exceptional 8.3% |
| Immigrants | Hungary | 89.9 /100 | #127 | Excellent 8.4% |
| Argentineans | 89.6 /100 | #128 | Excellent 8.4% |
| Portuguese | 89.2 /100 | #129 | Excellent 8.4% |
| Immigrants | Bosnia and Herzegovina | 88.6 /100 | #130 | Excellent 8.4% |
| Puget Sound Salish | 88.6 /100 | #131 | Excellent 8.4% |
| Immigrants | Argentina | 88.2 /100 | #132 | Excellent 8.4% |
| Sri Lankans | 86.6 /100 | #133 | Excellent 8.5% |
| Chileans | 86.6 /100 | #134 | Excellent 8.5% |
| Immigrants | Malaysia | 86.5 /100 | #135 | Excellent 8.5% |
| Immigrants | Brazil | 86.3 /100 | #136 | Excellent 8.5% |
| Immigrants | Southern Europe | 86.0 /100 | #137 | Excellent 8.5% |
| Armenians | 84.6 /100 | #138 | Excellent 8.5% |
Demographics Similar to Hondurans by Family Poverty
In terms of family poverty, the demographic groups most similar to Hondurans are Immigrants from Grenada (12.4%, a difference of 0.22%), U.S. Virgin Islander (12.4%, a difference of 0.22%), British West Indian (12.4%, a difference of 0.27%), Immigrants from Mexico (12.3%, a difference of 0.74%), and Inupiat (12.5%, a difference of 0.76%).
| Demographics | Rating | Rank | Family Poverty |
| Hispanics or Latinos | 0.0 /100 | #309 | Tragic 12.0% |
| Immigrants | Guatemala | 0.0 /100 | #310 | Tragic 12.0% |
| Ute | 0.0 /100 | #311 | Tragic 12.1% |
| Immigrants | Central America | 0.0 /100 | #312 | Tragic 12.1% |
| Immigrants | Caribbean | 0.0 /100 | #313 | Tragic 12.2% |
| Kiowa | 0.0 /100 | #314 | Tragic 12.2% |
| Immigrants | Mexico | 0.0 /100 | #315 | Tragic 12.3% |
| Hondurans | 0.0 /100 | #316 | Tragic 12.4% |
| Immigrants | Grenada | 0.0 /100 | #317 | Tragic 12.4% |
| U.S. Virgin Islanders | 0.0 /100 | #318 | Tragic 12.4% |
| British West Indians | 0.0 /100 | #319 | Tragic 12.4% |
| Inupiat | 0.0 /100 | #320 | Tragic 12.5% |
| Arapaho | 0.0 /100 | #321 | Tragic 12.7% |
| Immigrants | Honduras | 0.0 /100 | #322 | Tragic 12.7% |
| Menominee | 0.0 /100 | #323 | Tragic 12.7% |