Immigrants from Caribbean vs Immigrants from Honduras Child Poverty Under the Age of 5
COMPARE
Immigrants from Caribbean
Immigrants from Honduras
Child Poverty Under the Age of 5
Child Poverty Under the Age of 5 Comparison
Immigrants from Caribbean
Immigrants from Honduras
21.4%
CHILD POVERTY UNDER THE AGE OF 5
0.0/ 100
METRIC RATING
290th/ 347
METRIC RANK
23.5%
CHILD POVERTY UNDER THE AGE OF 5
0.0/ 100
METRIC RATING
321st/ 347
METRIC RANK
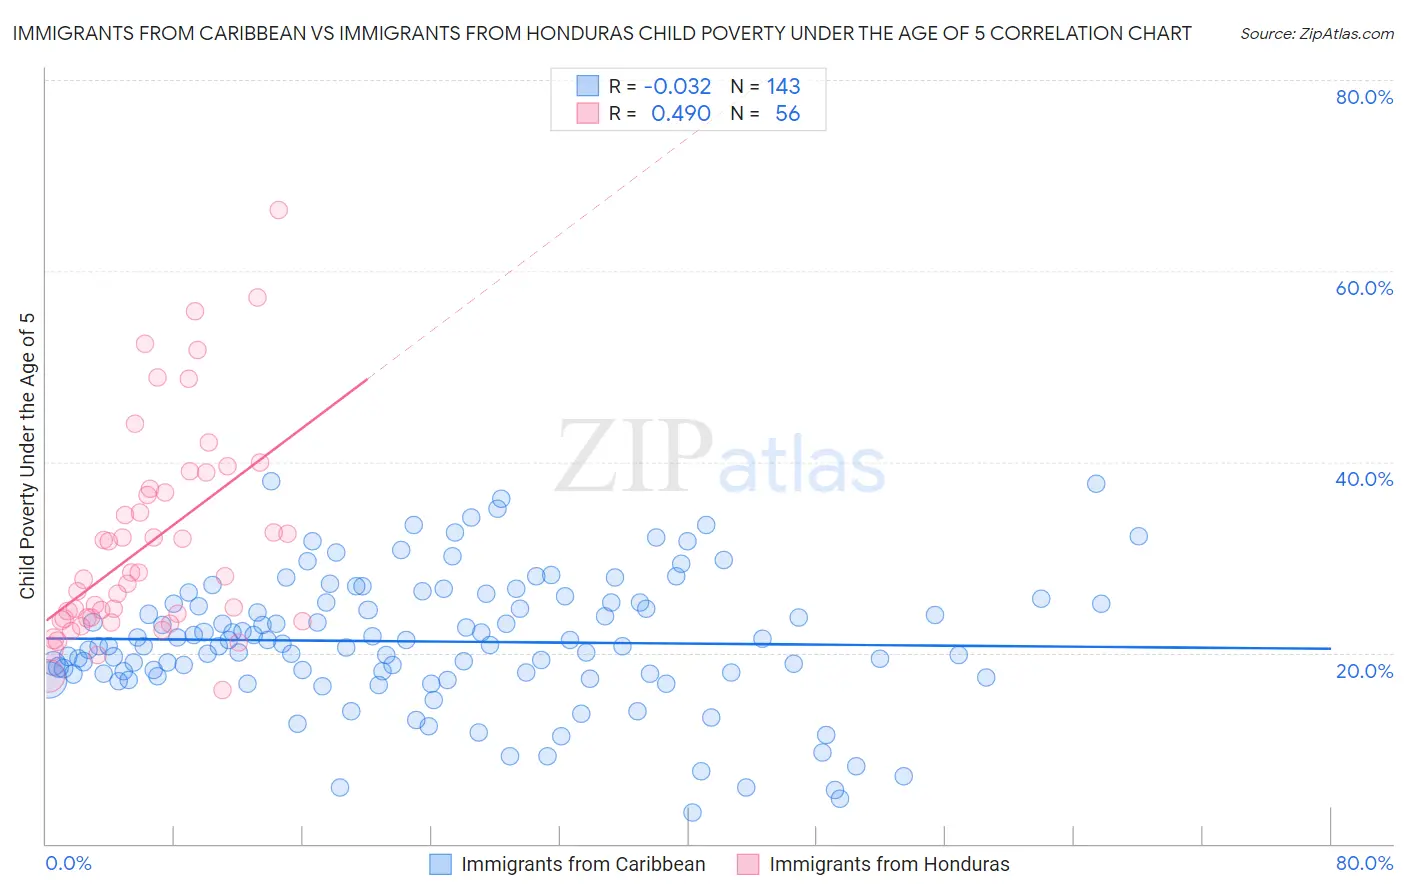
Immigrants from Caribbean vs Immigrants from Honduras Child Poverty Under the Age of 5 Correlation Chart
The statistical analysis conducted on geographies consisting of 429,670,121 people shows no correlation between the proportion of Immigrants from Caribbean and poverty level among children under the age of 5 in the United States with a correlation coefficient (R) of -0.032 and weighted average of 21.4%. Similarly, the statistical analysis conducted on geographies consisting of 316,401,171 people shows a moderate positive correlation between the proportion of Immigrants from Honduras and poverty level among children under the age of 5 in the United States with a correlation coefficient (R) of 0.490 and weighted average of 23.5%, a difference of 9.8%.
Child Poverty Under the Age of 5 Correlation Summary
| Measurement | Immigrants from Caribbean | Immigrants from Honduras |
| Minimum | 3.3% | 16.1% |
| Maximum | 38.0% | 66.4% |
| Range | 34.7% | 50.2% |
| Mean | 21.2% | 31.5% |
| Median | 20.8% | 27.9% |
| Interquartile 25% (IQ1) | 17.8% | 23.5% |
| Interquartile 75% (IQ3) | 25.3% | 37.0% |
| Interquartile Range (IQR) | 7.5% | 13.5% |
| Standard Deviation (Sample) | 6.9% | 11.0% |
| Standard Deviation (Population) | 6.8% | 10.9% |
Similar Demographics by Child Poverty Under the Age of 5
Demographics Similar to Immigrants from Caribbean by Child Poverty Under the Age of 5
In terms of child poverty under the age of 5, the demographic groups most similar to Immigrants from Caribbean are British West Indian (21.4%, a difference of 0.17%), Immigrants from Haiti (21.3%, a difference of 0.41%), Immigrants from Senegal (21.3%, a difference of 0.48%), Immigrants from Zaire (21.3%, a difference of 0.65%), and Immigrants from Latin America (21.2%, a difference of 0.75%).
| Demographics | Rating | Rank | Child Poverty Under the Age of 5 |
| Comanche | 0.0 /100 | #283 | Tragic 21.0% |
| Somalis | 0.0 /100 | #284 | Tragic 21.1% |
| Haitians | 0.0 /100 | #285 | Tragic 21.2% |
| Immigrants | Latin America | 0.0 /100 | #286 | Tragic 21.2% |
| Immigrants | Zaire | 0.0 /100 | #287 | Tragic 21.3% |
| Immigrants | Senegal | 0.0 /100 | #288 | Tragic 21.3% |
| Immigrants | Haiti | 0.0 /100 | #289 | Tragic 21.3% |
| Immigrants | Caribbean | 0.0 /100 | #290 | Tragic 21.4% |
| British West Indians | 0.0 /100 | #291 | Tragic 21.4% |
| Immigrants | Somalia | 0.0 /100 | #292 | Tragic 21.6% |
| Mexicans | 0.0 /100 | #293 | Tragic 21.6% |
| Guatemalans | 0.0 /100 | #294 | Tragic 21.6% |
| Cherokee | 0.0 /100 | #295 | Tragic 21.7% |
| Yaqui | 0.0 /100 | #296 | Tragic 21.7% |
| Hispanics or Latinos | 0.0 /100 | #297 | Tragic 21.7% |
Demographics Similar to Immigrants from Honduras by Child Poverty Under the Age of 5
In terms of child poverty under the age of 5, the demographic groups most similar to Immigrants from Honduras are Choctaw (23.5%, a difference of 0.030%), Ute (23.5%, a difference of 0.23%), Chippewa (23.4%, a difference of 0.41%), Pueblo (23.7%, a difference of 0.81%), and Dutch West Indian (23.3%, a difference of 0.89%).
| Demographics | Rating | Rank | Child Poverty Under the Age of 5 |
| U.S. Virgin Islanders | 0.0 /100 | #314 | Tragic 23.0% |
| Arapaho | 0.0 /100 | #315 | Tragic 23.1% |
| Yakama | 0.0 /100 | #316 | Tragic 23.1% |
| Menominee | 0.0 /100 | #317 | Tragic 23.3% |
| Dutch West Indians | 0.0 /100 | #318 | Tragic 23.3% |
| Chippewa | 0.0 /100 | #319 | Tragic 23.4% |
| Choctaw | 0.0 /100 | #320 | Tragic 23.5% |
| Immigrants | Honduras | 0.0 /100 | #321 | Tragic 23.5% |
| Ute | 0.0 /100 | #322 | Tragic 23.5% |
| Pueblo | 0.0 /100 | #323 | Tragic 23.7% |
| Paiute | 0.0 /100 | #324 | Tragic 23.8% |
| Immigrants | Congo | 0.0 /100 | #325 | Tragic 23.9% |
| Central American Indians | 0.0 /100 | #326 | Tragic 23.9% |
| Dominicans | 0.0 /100 | #327 | Tragic 24.0% |
| Immigrants | Dominican Republic | 0.0 /100 | #328 | Tragic 24.1% |