Pueblo vs Mexican Male Poverty
COMPARE
Pueblo
Mexican
Male Poverty
Male Poverty Comparison
Pueblo
Mexicans
18.5%
MALE POVERTY
0.0/ 100
METRIC RATING
336th/ 347
METRIC RANK
13.7%
MALE POVERTY
0.0/ 100
METRIC RATING
280th/ 347
METRIC RANK
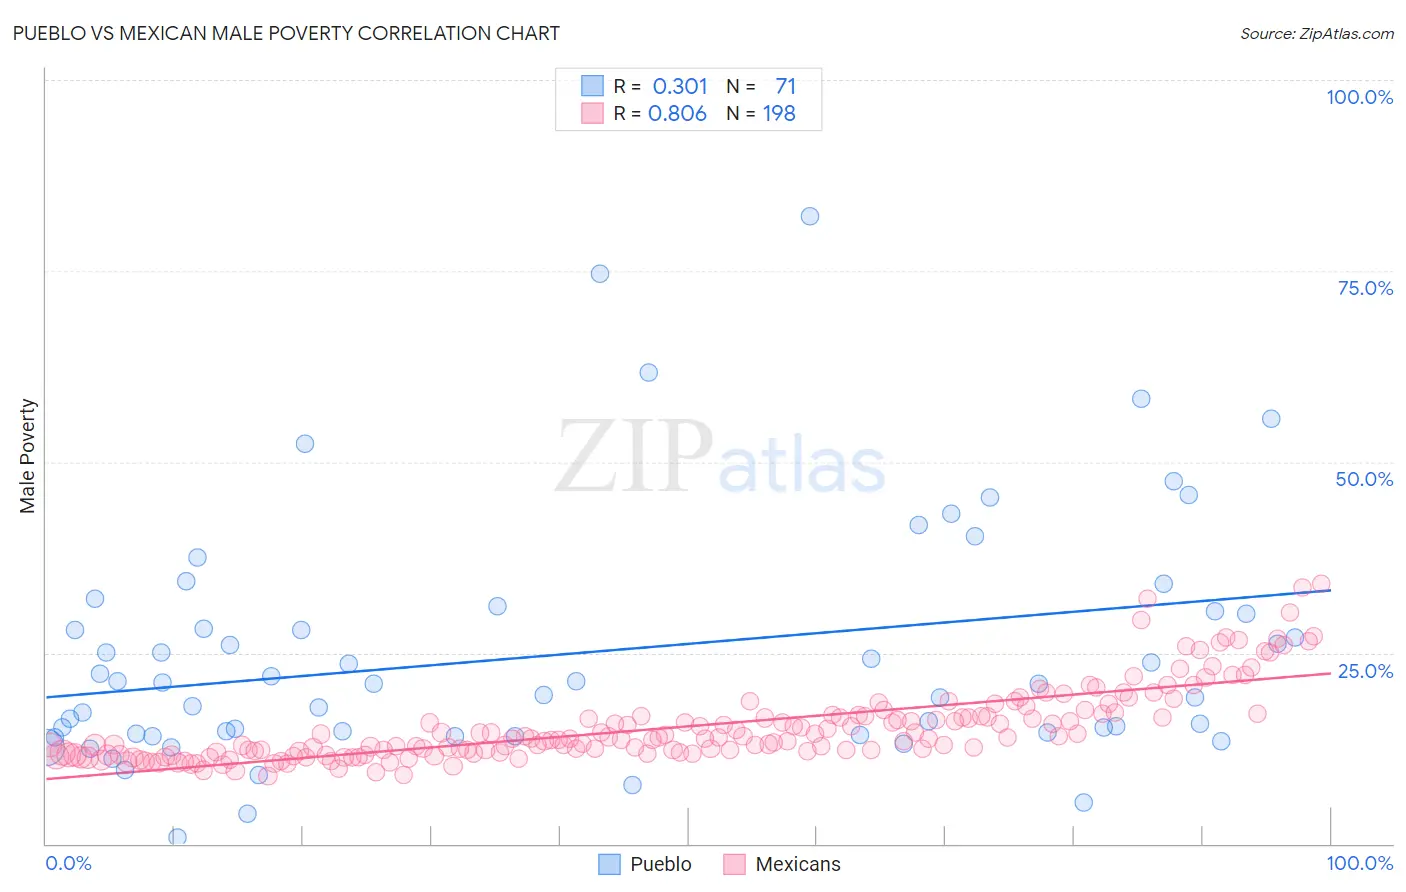
Pueblo vs Mexican Male Poverty Correlation Chart
The statistical analysis conducted on geographies consisting of 120,075,088 people shows a mild positive correlation between the proportion of Pueblo and poverty level among males in the United States with a correlation coefficient (R) of 0.301 and weighted average of 18.5%. Similarly, the statistical analysis conducted on geographies consisting of 563,818,602 people shows a very strong positive correlation between the proportion of Mexicans and poverty level among males in the United States with a correlation coefficient (R) of 0.806 and weighted average of 13.7%, a difference of 35.3%.
Male Poverty Correlation Summary
| Measurement | Pueblo | Mexican |
| Minimum | 0.86% | 8.9% |
| Maximum | 82.2% | 34.1% |
| Range | 81.3% | 25.2% |
| Mean | 25.0% | 15.3% |
| Median | 20.9% | 13.7% |
| Interquartile 25% (IQ1) | 14.5% | 11.9% |
| Interquartile 75% (IQ3) | 30.4% | 16.7% |
| Interquartile Range (IQR) | 15.9% | 4.8% |
| Standard Deviation (Sample) | 15.9% | 4.9% |
| Standard Deviation (Population) | 15.8% | 4.9% |
Similar Demographics by Male Poverty
Demographics Similar to Pueblo by Male Poverty
In terms of male poverty, the demographic groups most similar to Pueblo are Sioux (18.7%, a difference of 1.1%), Crow (19.1%, a difference of 3.4%), Apache (17.7%, a difference of 4.8%), Cheyenne (17.6%, a difference of 5.0%), and Yuman (19.5%, a difference of 5.6%).
| Demographics | Rating | Rank | Male Poverty |
| Dominicans | 0.0 /100 | #329 | Tragic 16.1% |
| Immigrants | Dominican Republic | 0.0 /100 | #330 | Tragic 16.2% |
| Ute | 0.0 /100 | #331 | Tragic 16.2% |
| Houma | 0.0 /100 | #332 | Tragic 16.7% |
| Natives/Alaskans | 0.0 /100 | #333 | Tragic 16.9% |
| Cheyenne | 0.0 /100 | #334 | Tragic 17.6% |
| Apache | 0.0 /100 | #335 | Tragic 17.7% |
| Pueblo | 0.0 /100 | #336 | Tragic 18.5% |
| Sioux | 0.0 /100 | #337 | Tragic 18.7% |
| Crow | 0.0 /100 | #338 | Tragic 19.1% |
| Yuman | 0.0 /100 | #339 | Tragic 19.5% |
| Immigrants | Yemen | 0.0 /100 | #340 | Tragic 20.1% |
| Lumbee | 0.0 /100 | #341 | Tragic 20.2% |
| Pima | 0.0 /100 | #342 | Tragic 20.4% |
| Yup'ik | 0.0 /100 | #343 | Tragic 20.4% |
Demographics Similar to Mexicans by Male Poverty
In terms of male poverty, the demographic groups most similar to Mexicans are Yaqui (13.7%, a difference of 0.050%), Haitian (13.7%, a difference of 0.090%), Belizean (13.6%, a difference of 0.27%), Immigrants from Cabo Verde (13.7%, a difference of 0.32%), and Bangladeshi (13.6%, a difference of 0.37%).
| Demographics | Rating | Rank | Male Poverty |
| Chickasaw | 0.0 /100 | #273 | Tragic 13.5% |
| Immigrants | West Indies | 0.0 /100 | #274 | Tragic 13.5% |
| Barbadians | 0.0 /100 | #275 | Tragic 13.6% |
| Immigrants | Latin America | 0.0 /100 | #276 | Tragic 13.6% |
| Bangladeshis | 0.0 /100 | #277 | Tragic 13.6% |
| Belizeans | 0.0 /100 | #278 | Tragic 13.6% |
| Haitians | 0.0 /100 | #279 | Tragic 13.7% |
| Mexicans | 0.0 /100 | #280 | Tragic 13.7% |
| Yaqui | 0.0 /100 | #281 | Tragic 13.7% |
| Immigrants | Cabo Verde | 0.0 /100 | #282 | Tragic 13.7% |
| Comanche | 0.0 /100 | #283 | Tragic 13.8% |
| Immigrants | Haiti | 0.0 /100 | #284 | Tragic 13.8% |
| West Indians | 0.0 /100 | #285 | Tragic 13.8% |
| Shoshone | 0.0 /100 | #286 | Tragic 13.8% |
| Immigrants | Barbados | 0.0 /100 | #287 | Tragic 13.8% |