Pueblo vs Immigrants from Norway Receiving Food Stamps

COMPARE

Pueblo
Race
Ancestry
AfghanAfricanAlaska NativeAlaskan AthabascanAlbanianAleutAlsatianAmericanApacheArabArapahoArgentineanArmenianAssyrian/Chaldean/SyriacAustralianAustrianBahamianBangladeshiBarbadianBasqueBelgianBelizeanBermudanBhutaneseBlackfeetBolivianBrazilianBritishBritish West IndianBulgarianBurmeseCajunCambodianCanadianCape VerdeanCarpatho RusynCelticCentral AmericanCentral American IndianCherokeeCheyenneChickasawChileanChineseChippewaChoctawColombianColvilleComancheCosta RicanCreeCreekCroatianCrowCubanCypriotCzechCzechoslovakianDanishDelawareDominicanDutchDutch West IndianEastern EuropeanEcuadorianEgyptianEnglishEstonianEthiopianEuropeanFijianFilipinoFinnishFrenchFrench American IndianFrench CanadianGermanGerman RussianGhanaianGreekGuamanian/ChamorroGuatemalanGuyaneseHaitianHmongHonduranHopiHoumaHungarianIcelanderIndian (Asian)IndonesianInupiatIranianIraqiIrishIroquoisIsraeliItalianJamaicanJapaneseJordanianKenyanKiowaKoreanLaotianLatvianLebaneseLiberianLithuanianLumbeeLuxembourgerMacedonianMalaysianMalteseMarshalleseMenomineeMexicanMexican American IndianMongolianMoroccanNative HawaiianNavajoNepaleseNew ZealanderNicaraguanNigerianNorthern EuropeanNorwegianOkinawanOsageOttawaPaiutePakistaniPalestinianPanamanianParaguayanPennsylvania GermanPeruvianPimaPolishPortuguesePotawatomiPuebloPuerto RicanPuget Sound SalishRomanianRussianSalvadoranSamoanScandinavianScotch-IrishScottishSeminoleSenegaleseSerbianShoshoneSierra LeoneanSiouxSlavicSlovakSloveneSomaliSouth AfricanSouth AmericanSouth American IndianSoviet UnionSpaniardSpanishSpanish AmericanSpanish American IndianSri LankanSubsaharan AfricanSudaneseSwedishSwissSyrianTaiwaneseThaiTlingit-HaidaTohono O'OdhamTonganTrinidadian and TobagonianTsimshianTurkishU.S. Virgin IslanderUgandanUkrainianUruguayanUteVenezuelanVietnameseWelshWest IndianYakamaYaquiYugoslavianYumanYup'ikZimbabwean
Immigration
NonimmigrantsImmigrantsAfghanistanAfricaAlbaniaArgentinaArmeniaAsiaAustraliaAustriaBahamasBangladeshBarbadosBelarusBelgiumBelizeBoliviaBosnia and HerzegovinaBrazilBulgariaBurma/MyanmarCabo VerdeCambodiaCameroonCanadaCaribbeanCentral AmericaChileChinaColombiaCongoCosta RicaCroatiaCubaCzechoslovakiaDenmarkDominicaDominican RepublicEastern AfricaEastern AsiaEastern EuropeEcuadorEgyptEl SalvadorEnglandEritreaEthiopiaEuropeFijiFranceGermanyGhanaGreeceGrenadaGuatemalaGuyanaHaitiHondurasHong KongHungaryIndiaIndonesiaIranIraqIrelandIsraelItalyJamaicaJapanJordanKazakhstanKenyaKoreaKuwaitLaosLatin AmericaLatviaLebanonLiberiaLithuaniaMalaysiaMexicoMicronesiaMiddle AfricaMoldovaMoroccoNepalNetherlandsNicaraguaNigeriaNorth AmericaNorth MacedoniaNorthern AfricaNorthern EuropeOceaniaPakistanPanamaPeruPhilippinesPolandPortugalRomaniaRussiaSaudi ArabiaScotlandSenegalSerbiaSierra LeoneSingaporeSomaliaSouth AfricaSouth AmericaSouth Central AsiaSouth Eastern AsiaSouthern EuropeSpainSri LankaSt. Vincent and the GrenadinesSudanSwedenSwitzerlandSyriaTaiwanThailandTrinidad and TobagoTurkeyUgandaUkraineUruguayUzbekistanVenezuelaVietnamWest IndiesWestern AfricaWestern AsiaWestern EuropeYemenZaireZimbabweAzores
Immigrants from Norway
Race
Ancestry
AfghanAfricanAlaska NativeAlaskan AthabascanAlbanianAleutAlsatianAmericanApacheArabArapahoArgentineanArmenianAssyrian/Chaldean/SyriacAustralianAustrianBahamianBangladeshiBarbadianBasqueBelgianBelizeanBermudanBhutaneseBlackfeetBolivianBrazilianBritishBritish West IndianBulgarianBurmeseCajunCambodianCanadianCape VerdeanCarpatho RusynCelticCentral AmericanCentral American IndianCherokeeCheyenneChickasawChileanChineseChippewaChoctawColombianColvilleComancheCosta RicanCreeCreekCroatianCrowCubanCypriotCzechCzechoslovakianDanishDelawareDominicanDutchDutch West IndianEastern EuropeanEcuadorianEgyptianEnglishEstonianEthiopianEuropeanFijianFilipinoFinnishFrenchFrench American IndianFrench CanadianGermanGerman RussianGhanaianGreekGuamanian/ChamorroGuatemalanGuyaneseHaitianHmongHonduranHopiHoumaHungarianIcelanderIndian (Asian)IndonesianInupiatIranianIraqiIrishIroquoisIsraeliItalianJamaicanJapaneseJordanianKenyanKiowaKoreanLaotianLatvianLebaneseLiberianLithuanianLumbeeLuxembourgerMacedonianMalaysianMalteseMarshalleseMenomineeMexicanMexican American IndianMongolianMoroccanNative HawaiianNavajoNepaleseNew ZealanderNicaraguanNigerianNorthern EuropeanNorwegianOkinawanOsageOttawaPaiutePakistaniPalestinianPanamanianParaguayanPennsylvania GermanPeruvianPimaPolishPortuguesePotawatomiPuerto RicanPuget Sound SalishRomanianRussianSalvadoranSamoanScandinavianScotch-IrishScottishSeminoleSenegaleseSerbianShoshoneSierra LeoneanSiouxSlavicSlovakSloveneSomaliSouth AfricanSouth AmericanSouth American IndianSoviet UnionSpaniardSpanishSpanish AmericanSpanish American IndianSri LankanSubsaharan AfricanSudaneseSwedishSwissSyrianTaiwaneseThaiTlingit-HaidaTohono O'OdhamTonganTrinidadian and TobagonianTsimshianTurkishU.S. Virgin IslanderUgandanUkrainianUruguayanUteVenezuelanVietnameseWelshWest IndianYakamaYaquiYugoslavianYumanYup'ikZimbabwean
Immigration
NonimmigrantsImmigrantsAfghanistanAfricaAlbaniaArgentinaArmeniaAsiaAustraliaAustriaBahamasBangladeshBarbadosBelarusBelgiumBelizeBoliviaBosnia and HerzegovinaBrazilBulgariaBurma/MyanmarCabo VerdeCambodiaCameroonCanadaCaribbeanCentral AmericaChileChinaColombiaCongoCosta RicaCroatiaCubaCzechoslovakiaDenmarkDominicaDominican RepublicEastern AfricaEastern AsiaEastern EuropeEcuadorEgyptEl SalvadorEnglandEritreaEthiopiaEuropeFijiFranceGermanyGhanaGreeceGrenadaGuatemalaGuyanaHaitiHondurasHong KongHungaryIndiaIndonesiaIranIraqIrelandIsraelItalyJamaicaJapanJordanKazakhstanKenyaKoreaKuwaitLaosLatin AmericaLatviaLebanonLiberiaLithuaniaMalaysiaMexicoMicronesiaMiddle AfricaMoldovaMoroccoNepalNetherlandsNicaraguaNigeriaNorth AmericaNorth MacedoniaNorthern AfricaNorthern EuropeNorwayOceaniaPakistanPanamaPeruPhilippinesPolandPortugalRomaniaRussiaSaudi ArabiaScotlandSenegalSerbiaSierra LeoneSingaporeSomaliaSouth AfricaSouth AmericaSouth Central AsiaSouth Eastern AsiaSouthern EuropeSpainSri LankaSt. Vincent and the GrenadinesSudanSwedenSwitzerlandSyriaTaiwanThailandTrinidad and TobagoTurkeyUgandaUkraineUruguayUzbekistanVenezuelaVietnamWest IndiesWestern AfricaWestern AsiaWestern EuropeYemenZaireZimbabweAzores
Receiving Food Stamps
Income
Poverty
Unemployment
Labor Participation
Family Structure
Vehicle Availability
Education Level
Disability

Receiving Food Stamps Comparison

Pueblo

Immigrants from Norway

Tragic
Exceptional
19.9%
RECEIVING FOOD STAMPS
0.0/ 100
METRIC RATING
332nd/ 347
METRIC RANK
10.0%
RECEIVING FOOD STAMPS
98.4/ 100
METRIC RATING
86th/ 347
METRIC RANK

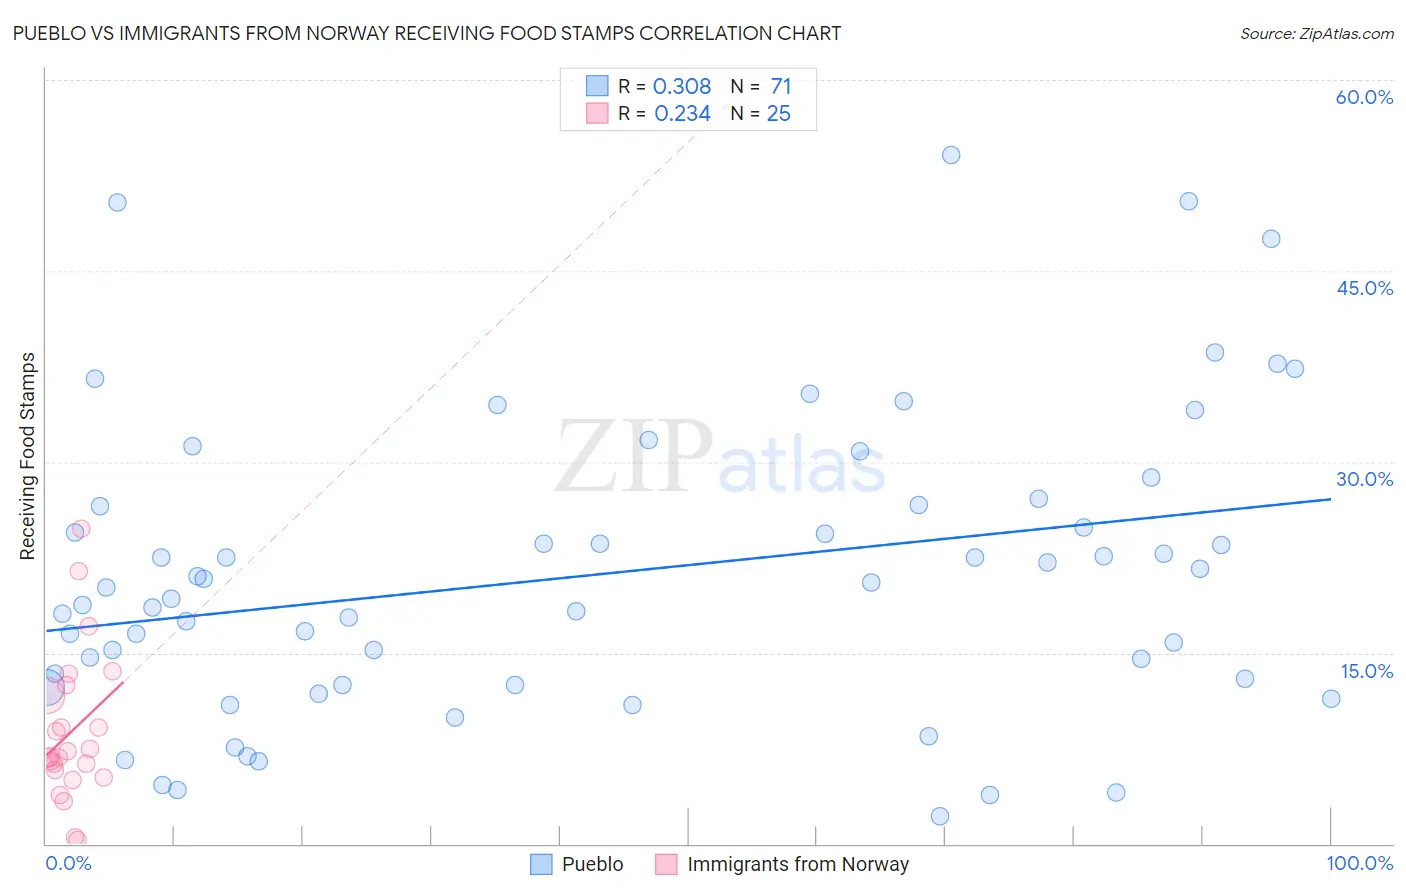
Pueblo vs Immigrants from Norway Receiving Food Stamps Correlation Chart

The statistical analysis conducted on geographies consisting of 120,026,955 people shows a mild positive correlation between the proportion of Pueblo and percentage of population receiving government assistance and/or food stamps in the United States with a correlation coefficient (R) of 0.308 and weighted average of 19.9%. Similarly, the statistical analysis conducted on geographies consisting of 116,612,325 people shows a weak positive correlation between the proportion of Immigrants from Norway and percentage of population receiving government assistance and/or food stamps in the United States with a correlation coefficient (R) of 0.234 and weighted average of 10.0%, a difference of 98.4%.
Pueblo vs Immigrants from Norway Receiving Food Stamps

Receiving Food Stamps Correlation Summary

MeasurementPuebloImmigrants from Norway
Minimum2.2%0.30%
Maximum54.1%24.7%
Range51.9%24.4%
Mean21.2%8.8%
Median20.2%6.8%
Interquartile 25% (IQ1)12.5%5.5%
Interquartile 75% (IQ3)26.6%12.0%
Interquartile Range (IQR)14.1%6.6%
Standard Deviation (Sample)11.7%5.8%
Standard Deviation (Population)11.6%5.7%

Similar Demographics by Receiving Food Stamps

Demographics Similar to Pueblo by Receiving Food Stamps

In terms of receiving food stamps, the demographic groups most similar to Pueblo are Inupiat (20.1%, a difference of 0.73%), Immigrants from Caribbean (19.6%, a difference of 1.5%), Yuman (20.2%, a difference of 1.6%), Immigrants from Cuba (20.8%, a difference of 4.6%), and Pima (19.0%, a difference of 5.0%).
DemographicsRating | RankReceiving Food Stamps
Immigrants | Haiti
0.0
/100
|
#325
Tragic
18.2%
Cubans
0.0
/100
|
#326
Tragic
18.2%
Apache
0.0
/100
|
#327
Tragic
18.3%
Colville
0.0
/100
|
#328
Tragic
18.3%
Immigrants | Dominica
0.0
/100
|
#329
Tragic
18.4%
Pima
0.0
/100
|
#330
Tragic
19.0%
Immigrants | Caribbean
0.0
/100
|
#331
Tragic
19.6%
Pueblo
0.0
/100
|
#332
Tragic
19.9%
Inupiat
0.0
/100
|
#333
Tragic
20.1%
Yuman
0.0
/100
|
#334
Tragic
20.2%
Immigrants | Cuba
0.0
/100
|
#335
Tragic
20.8%
Navajo
0.0
/100
|
#336
Tragic
21.1%
Cape Verdeans
0.0
/100
|
#337
Tragic
21.1%
Dominicans
0.0
/100
|
#338
Tragic
21.4%
Yakama
0.0
/100
|
#339
Tragic
21.4%

Demographics Similar to Immigrants from Norway by Receiving Food Stamps

In terms of receiving food stamps, the demographic groups most similar to Immigrants from Norway are Egyptian (10.0%, a difference of 0.030%), Immigrants from Kuwait (10.0%, a difference of 0.090%), Immigrants from Romania (10.0%, a difference of 0.10%), Immigrants from Israel (10.0%, a difference of 0.27%), and Immigrants from France (10.1%, a difference of 0.34%).
DemographicsRating | RankReceiving Food Stamps
Laotians
98.7
/100
|
#79
Exceptional
10.0%
Poles
98.6
/100
|
#80
Exceptional
10.0%
Immigrants | England
98.6
/100
|
#81
Exceptional
10.0%
Austrians
98.6
/100
|
#82
Exceptional
10.0%
Dutch
98.6
/100
|
#83
Exceptional
10.0%
Immigrants | Israel
98.5
/100
|
#84
Exceptional
10.0%
Immigrants | Romania
98.5
/100
|
#85
Exceptional
10.0%
Immigrants | Norway
98.4
/100
|
#86
Exceptional
10.0%
Egyptians
98.4
/100
|
#87
Exceptional
10.0%
Immigrants | Kuwait
98.4
/100
|
#88
Exceptional
10.0%
Immigrants | France
98.3
/100
|
#89
Exceptional
10.1%
Finns
97.9
/100
|
#90
Exceptional
10.2%
Jordanians
97.9
/100
|
#91
Exceptional
10.2%
Irish
97.9
/100
|
#92
Exceptional
10.2%
Belgians
97.7
/100
|
#93
Exceptional
10.2%