Pueblo vs Immigrants from Italy Receiving Food Stamps
COMPARE
Pueblo
Immigrants from Italy
Receiving Food Stamps
Receiving Food Stamps Comparison
Pueblo
Immigrants from Italy
19.9%
RECEIVING FOOD STAMPS
0.0/ 100
METRIC RATING
332nd/ 347
METRIC RANK
10.4%
RECEIVING FOOD STAMPS
96.4/ 100
METRIC RATING
106th/ 347
METRIC RANK
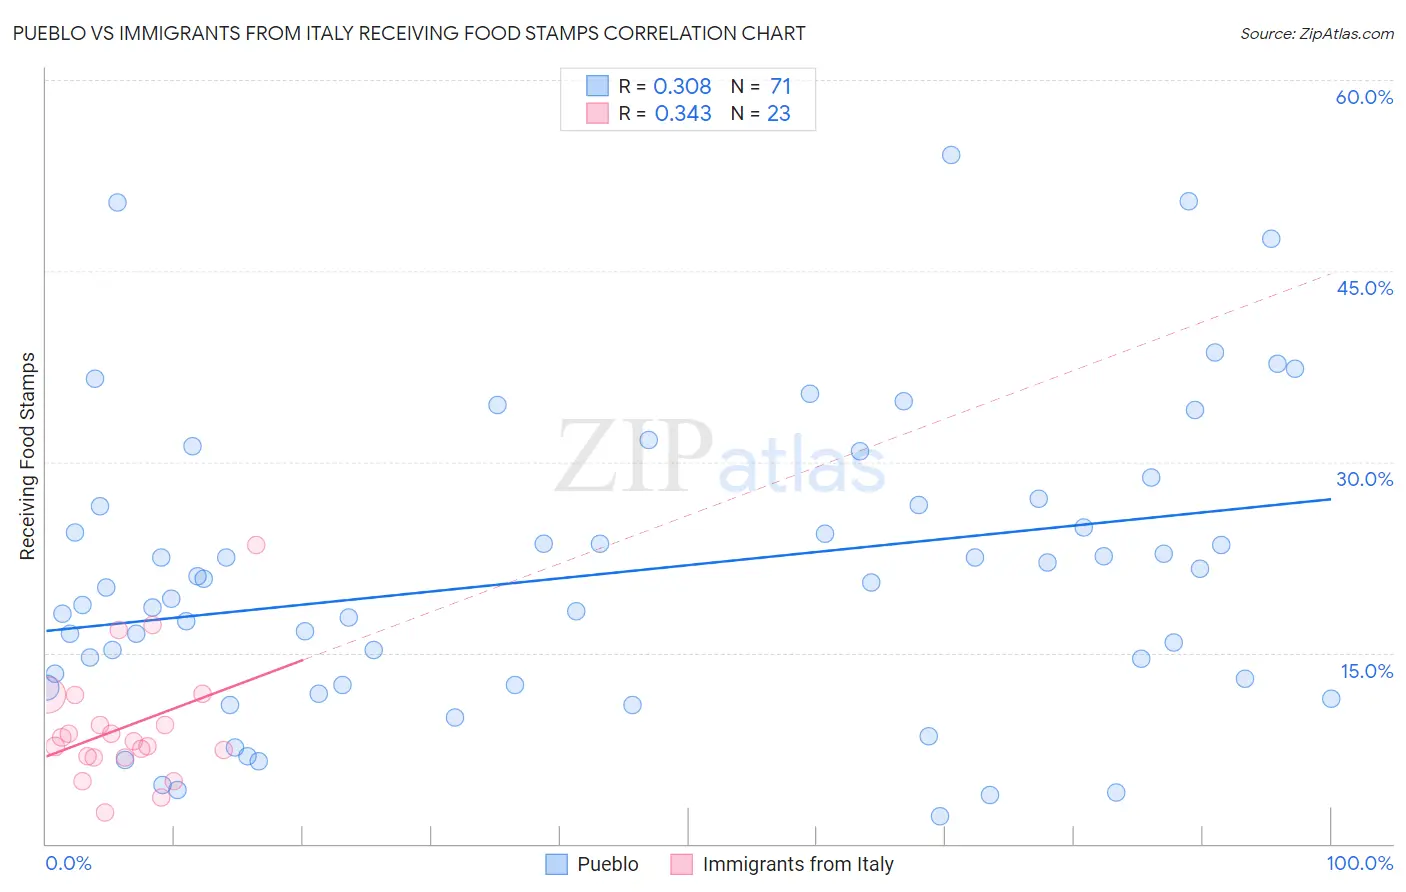
Pueblo vs Immigrants from Italy Receiving Food Stamps Correlation Chart
The statistical analysis conducted on geographies consisting of 120,026,955 people shows a mild positive correlation between the proportion of Pueblo and percentage of population receiving government assistance and/or food stamps in the United States with a correlation coefficient (R) of 0.308 and weighted average of 19.9%. Similarly, the statistical analysis conducted on geographies consisting of 323,254,250 people shows a mild positive correlation between the proportion of Immigrants from Italy and percentage of population receiving government assistance and/or food stamps in the United States with a correlation coefficient (R) of 0.343 and weighted average of 10.4%, a difference of 91.7%.
Receiving Food Stamps Correlation Summary
| Measurement | Pueblo | Immigrants from Italy |
| Minimum | 2.2% | 2.5% |
| Maximum | 54.1% | 23.5% |
| Range | 51.9% | 21.0% |
| Mean | 21.2% | 9.2% |
| Median | 20.2% | 8.1% |
| Interquartile 25% (IQ1) | 12.5% | 6.8% |
| Interquartile 75% (IQ3) | 26.6% | 11.7% |
| Interquartile Range (IQR) | 14.1% | 4.9% |
| Standard Deviation (Sample) | 11.7% | 4.7% |
| Standard Deviation (Population) | 11.6% | 4.6% |
Similar Demographics by Receiving Food Stamps
Demographics Similar to Pueblo by Receiving Food Stamps
In terms of receiving food stamps, the demographic groups most similar to Pueblo are Inupiat (20.1%, a difference of 0.73%), Immigrants from Caribbean (19.6%, a difference of 1.5%), Yuman (20.2%, a difference of 1.6%), Immigrants from Cuba (20.8%, a difference of 4.6%), and Pima (19.0%, a difference of 5.0%).
| Demographics | Rating | Rank | Receiving Food Stamps |
| Immigrants | Haiti | 0.0 /100 | #325 | Tragic 18.2% |
| Cubans | 0.0 /100 | #326 | Tragic 18.2% |
| Apache | 0.0 /100 | #327 | Tragic 18.3% |
| Colville | 0.0 /100 | #328 | Tragic 18.3% |
| Immigrants | Dominica | 0.0 /100 | #329 | Tragic 18.4% |
| Pima | 0.0 /100 | #330 | Tragic 19.0% |
| Immigrants | Caribbean | 0.0 /100 | #331 | Tragic 19.6% |
| Pueblo | 0.0 /100 | #332 | Tragic 19.9% |
| Inupiat | 0.0 /100 | #333 | Tragic 20.1% |
| Yuman | 0.0 /100 | #334 | Tragic 20.2% |
| Immigrants | Cuba | 0.0 /100 | #335 | Tragic 20.8% |
| Navajo | 0.0 /100 | #336 | Tragic 21.1% |
| Cape Verdeans | 0.0 /100 | #337 | Tragic 21.1% |
| Dominicans | 0.0 /100 | #338 | Tragic 21.4% |
| Yakama | 0.0 /100 | #339 | Tragic 21.4% |
Demographics Similar to Immigrants from Italy by Receiving Food Stamps
In terms of receiving food stamps, the demographic groups most similar to Immigrants from Italy are Immigrants from Malaysia (10.4%, a difference of 0.090%), Korean (10.4%, a difference of 0.15%), Carpatho Rusyn (10.4%, a difference of 0.19%), Immigrants from Pakistan (10.4%, a difference of 0.23%), and Immigrants from Hungary (10.3%, a difference of 0.41%).
| Demographics | Rating | Rank | Receiving Food Stamps |
| Serbians | 97.0 /100 | #99 | Exceptional 10.3% |
| Immigrants | Western Europe | 96.9 /100 | #100 | Exceptional 10.3% |
| Palestinians | 96.9 /100 | #101 | Exceptional 10.3% |
| Immigrants | Europe | 96.8 /100 | #102 | Exceptional 10.3% |
| Immigrants | Latvia | 96.8 /100 | #103 | Exceptional 10.3% |
| Immigrants | Hungary | 96.7 /100 | #104 | Exceptional 10.3% |
| Immigrants | Malaysia | 96.5 /100 | #105 | Exceptional 10.4% |
| Immigrants | Italy | 96.4 /100 | #106 | Exceptional 10.4% |
| Koreans | 96.3 /100 | #107 | Exceptional 10.4% |
| Carpatho Rusyns | 96.2 /100 | #108 | Exceptional 10.4% |
| Immigrants | Pakistan | 96.2 /100 | #109 | Exceptional 10.4% |
| Pakistanis | 95.9 /100 | #110 | Exceptional 10.4% |
| Romanians | 95.8 /100 | #111 | Exceptional 10.4% |
| Mongolians | 95.8 /100 | #112 | Exceptional 10.5% |
| Icelanders | 95.4 /100 | #113 | Exceptional 10.5% |