Immigrants from Armenia vs Immigrants from Norway Receiving Food Stamps
COMPARE
Immigrants from Armenia
Immigrants from Norway
Receiving Food Stamps
Receiving Food Stamps Comparison
Immigrants from Armenia
Immigrants from Norway
13.0%
RECEIVING FOOD STAMPS
4.3/ 100
METRIC RATING
224th/ 347
METRIC RANK
10.0%
RECEIVING FOOD STAMPS
98.4/ 100
METRIC RATING
86th/ 347
METRIC RANK
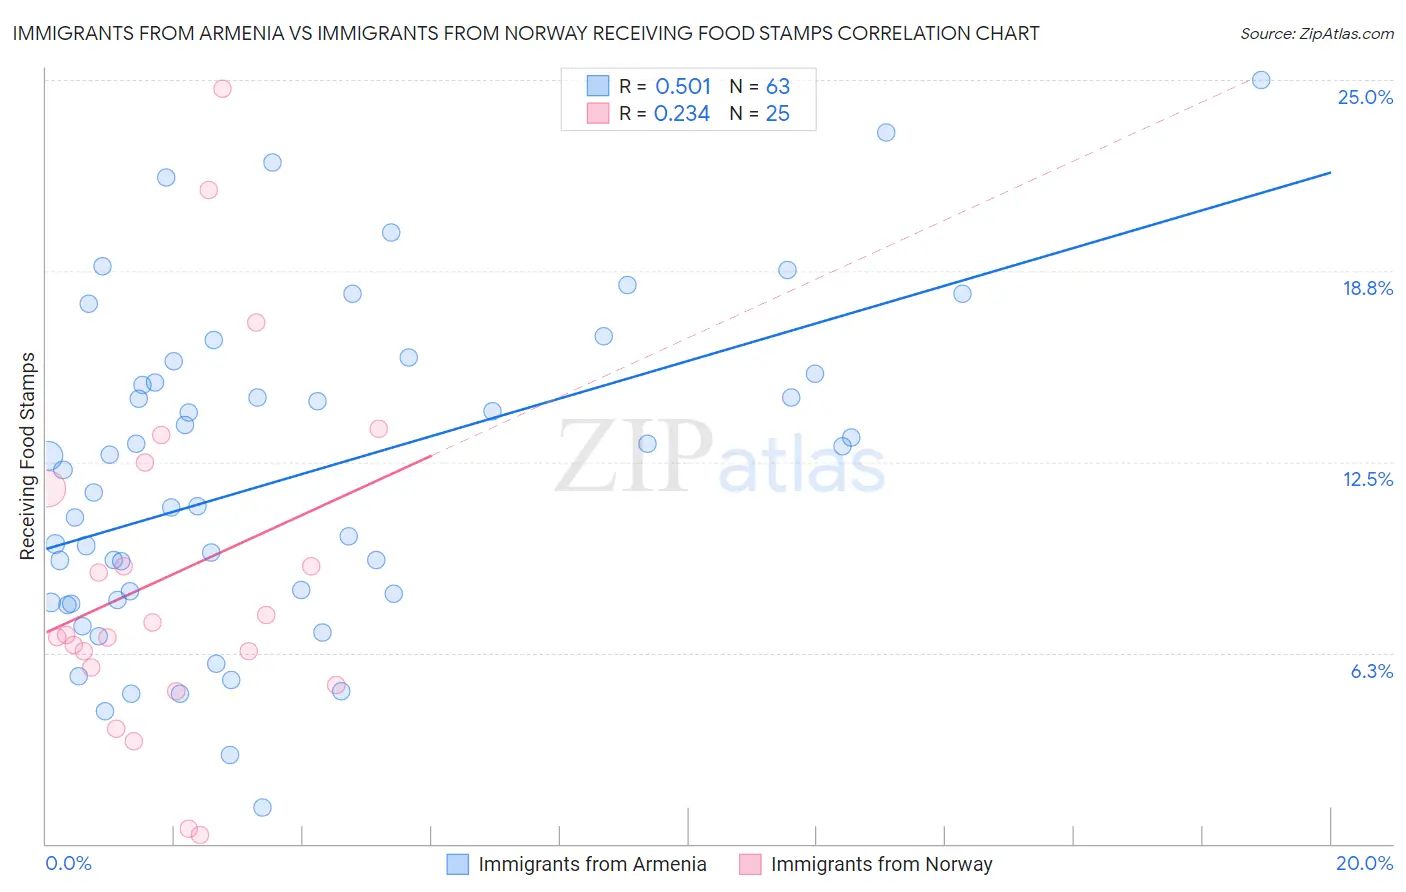
Immigrants from Armenia vs Immigrants from Norway Receiving Food Stamps Correlation Chart
The statistical analysis conducted on geographies consisting of 97,612,331 people shows a substantial positive correlation between the proportion of Immigrants from Armenia and percentage of population receiving government assistance and/or food stamps in the United States with a correlation coefficient (R) of 0.501 and weighted average of 13.0%. Similarly, the statistical analysis conducted on geographies consisting of 116,612,325 people shows a weak positive correlation between the proportion of Immigrants from Norway and percentage of population receiving government assistance and/or food stamps in the United States with a correlation coefficient (R) of 0.234 and weighted average of 10.0%, a difference of 29.7%.
Receiving Food Stamps Correlation Summary
| Measurement | Immigrants from Armenia | Immigrants from Norway |
| Minimum | 1.2% | 0.30% |
| Maximum | 25.0% | 24.7% |
| Range | 23.8% | 24.4% |
| Mean | 12.1% | 8.8% |
| Median | 12.2% | 6.8% |
| Interquartile 25% (IQ1) | 8.0% | 5.5% |
| Interquartile 75% (IQ3) | 15.4% | 12.0% |
| Interquartile Range (IQR) | 7.4% | 6.6% |
| Standard Deviation (Sample) | 5.3% | 5.8% |
| Standard Deviation (Population) | 5.2% | 5.7% |
Similar Demographics by Receiving Food Stamps
Demographics Similar to Immigrants from Armenia by Receiving Food Stamps
In terms of receiving food stamps, the demographic groups most similar to Immigrants from Armenia are Fijian (13.0%, a difference of 0.020%), Immigrants from Albania (13.0%, a difference of 0.070%), Immigrants (13.0%, a difference of 0.11%), Bermudan (13.0%, a difference of 0.37%), and Chickasaw (13.1%, a difference of 0.62%).
| Demographics | Rating | Rank | Receiving Food Stamps |
| Immigrants | Burma/Myanmar | 6.0 /100 | #217 | Tragic 12.9% |
| Hawaiians | 5.4 /100 | #218 | Tragic 12.9% |
| Immigrants | Middle Africa | 5.4 /100 | #219 | Tragic 12.9% |
| Immigrants | Colombia | 5.3 /100 | #220 | Tragic 12.9% |
| Bermudans | 4.8 /100 | #221 | Tragic 13.0% |
| Immigrants | Immigrants | 4.4 /100 | #222 | Tragic 13.0% |
| Immigrants | Albania | 4.4 /100 | #223 | Tragic 13.0% |
| Immigrants | Armenia | 4.3 /100 | #224 | Tragic 13.0% |
| Fijians | 4.3 /100 | #225 | Tragic 13.0% |
| Chickasaw | 3.6 /100 | #226 | Tragic 13.1% |
| Nigerians | 3.5 /100 | #227 | Tragic 13.1% |
| Panamanians | 3.5 /100 | #228 | Tragic 13.1% |
| Ottawa | 3.5 /100 | #229 | Tragic 13.1% |
| Puget Sound Salish | 3.4 /100 | #230 | Tragic 13.1% |
| Immigrants | Nigeria | 3.4 /100 | #231 | Tragic 13.1% |
Demographics Similar to Immigrants from Norway by Receiving Food Stamps
In terms of receiving food stamps, the demographic groups most similar to Immigrants from Norway are Egyptian (10.0%, a difference of 0.030%), Immigrants from Kuwait (10.0%, a difference of 0.090%), Immigrants from Romania (10.0%, a difference of 0.10%), Immigrants from Israel (10.0%, a difference of 0.27%), and Immigrants from France (10.1%, a difference of 0.34%).
| Demographics | Rating | Rank | Receiving Food Stamps |
| Laotians | 98.7 /100 | #79 | Exceptional 10.0% |
| Poles | 98.6 /100 | #80 | Exceptional 10.0% |
| Immigrants | England | 98.6 /100 | #81 | Exceptional 10.0% |
| Austrians | 98.6 /100 | #82 | Exceptional 10.0% |
| Dutch | 98.6 /100 | #83 | Exceptional 10.0% |
| Immigrants | Israel | 98.5 /100 | #84 | Exceptional 10.0% |
| Immigrants | Romania | 98.5 /100 | #85 | Exceptional 10.0% |
| Immigrants | Norway | 98.4 /100 | #86 | Exceptional 10.0% |
| Egyptians | 98.4 /100 | #87 | Exceptional 10.0% |
| Immigrants | Kuwait | 98.4 /100 | #88 | Exceptional 10.0% |
| Immigrants | France | 98.3 /100 | #89 | Exceptional 10.1% |
| Finns | 97.9 /100 | #90 | Exceptional 10.2% |
| Jordanians | 97.9 /100 | #91 | Exceptional 10.2% |
| Irish | 97.9 /100 | #92 | Exceptional 10.2% |
| Belgians | 97.7 /100 | #93 | Exceptional 10.2% |