South African vs Immigrants from Norway Receiving Food Stamps
COMPARE
South African
Immigrants from Norway
Receiving Food Stamps
Receiving Food Stamps Comparison
South Africans
Immigrants from Norway
10.0%
RECEIVING FOOD STAMPS
98.7/ 100
METRIC RATING
78th/ 347
METRIC RANK
10.0%
RECEIVING FOOD STAMPS
98.4/ 100
METRIC RATING
86th/ 347
METRIC RANK
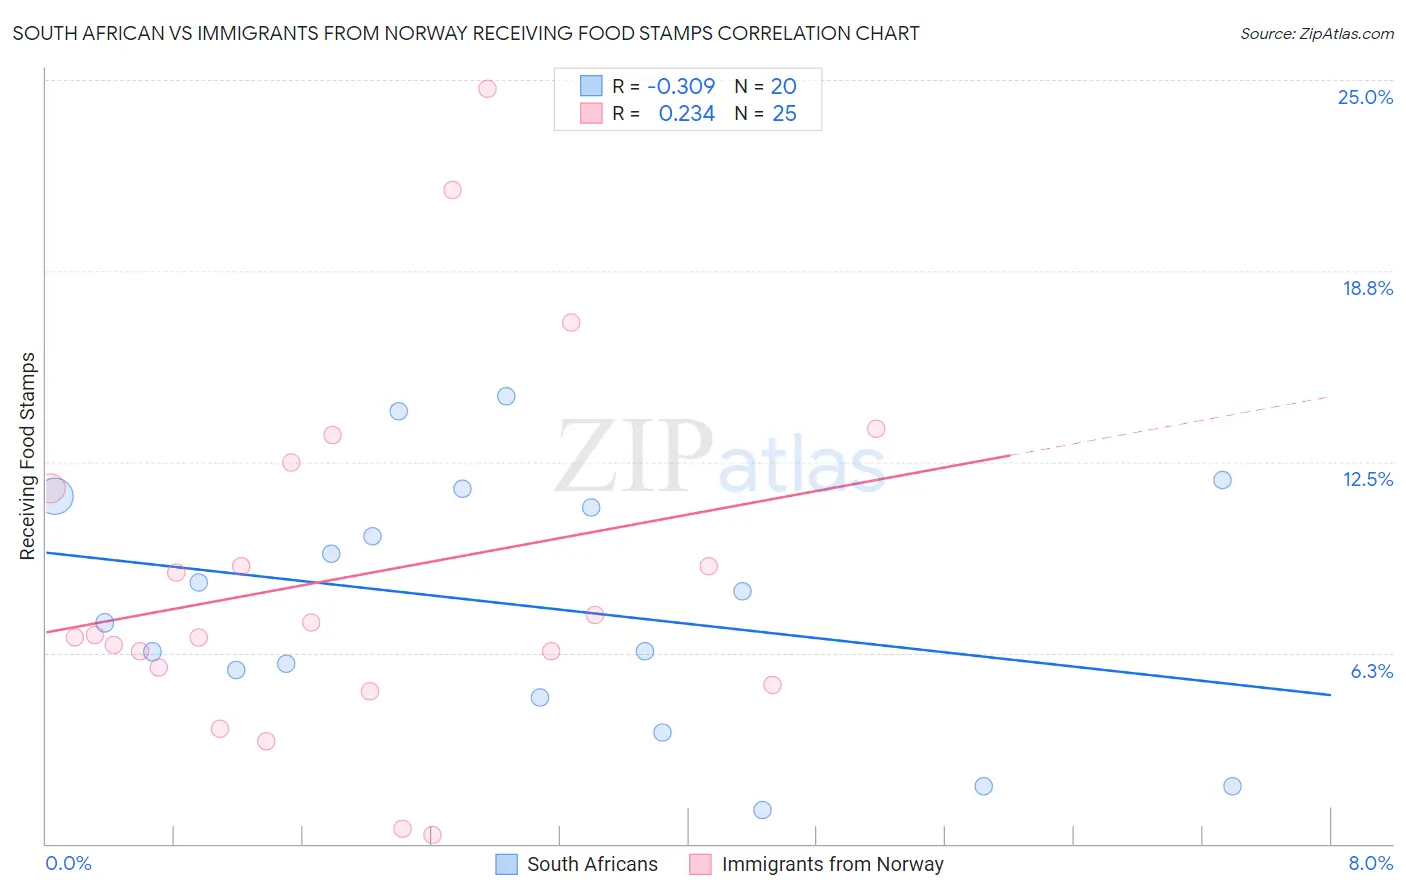
South African vs Immigrants from Norway Receiving Food Stamps Correlation Chart
The statistical analysis conducted on geographies consisting of 182,246,088 people shows a mild negative correlation between the proportion of South Africans and percentage of population receiving government assistance and/or food stamps in the United States with a correlation coefficient (R) of -0.309 and weighted average of 10.0%. Similarly, the statistical analysis conducted on geographies consisting of 116,612,325 people shows a weak positive correlation between the proportion of Immigrants from Norway and percentage of population receiving government assistance and/or food stamps in the United States with a correlation coefficient (R) of 0.234 and weighted average of 10.0%, a difference of 0.74%.
Receiving Food Stamps Correlation Summary
| Measurement | South African | Immigrants from Norway |
| Minimum | 1.1% | 0.30% |
| Maximum | 14.6% | 24.7% |
| Range | 13.5% | 24.4% |
| Mean | 7.8% | 8.8% |
| Median | 7.8% | 6.8% |
| Interquartile 25% (IQ1) | 5.2% | 5.5% |
| Interquartile 75% (IQ3) | 11.2% | 12.0% |
| Interquartile Range (IQR) | 6.0% | 6.6% |
| Standard Deviation (Sample) | 4.0% | 5.8% |
| Standard Deviation (Population) | 3.9% | 5.7% |
Demographics Similar to South Africans and Immigrants from Norway by Receiving Food Stamps
In terms of receiving food stamps, the demographic groups most similar to South Africans are Laotian (10.0%, a difference of 0.040%), Immigrants from North Macedonia (10.0%, a difference of 0.050%), Polish (10.0%, a difference of 0.12%), Immigrants from Croatia (10.0%, a difference of 0.13%), and Immigrants from Zimbabwe (9.9%, a difference of 0.14%). Similarly, the demographic groups most similar to Immigrants from Norway are Egyptian (10.0%, a difference of 0.030%), Immigrants from Kuwait (10.0%, a difference of 0.090%), Immigrants from Romania (10.0%, a difference of 0.10%), Immigrants from Israel (10.0%, a difference of 0.27%), and Immigrants from France (10.1%, a difference of 0.34%).
| Demographics | Rating | Rank | Receiving Food Stamps |
| Immigrants | Asia | 98.9 /100 | #72 | Exceptional 9.9% |
| Macedonians | 98.9 /100 | #73 | Exceptional 9.9% |
| New Zealanders | 98.8 /100 | #74 | Exceptional 9.9% |
| Immigrants | Zimbabwe | 98.7 /100 | #75 | Exceptional 9.9% |
| Immigrants | Croatia | 98.7 /100 | #76 | Exceptional 10.0% |
| Immigrants | North Macedonia | 98.7 /100 | #77 | Exceptional 10.0% |
| South Africans | 98.7 /100 | #78 | Exceptional 10.0% |
| Laotians | 98.7 /100 | #79 | Exceptional 10.0% |
| Poles | 98.6 /100 | #80 | Exceptional 10.0% |
| Immigrants | England | 98.6 /100 | #81 | Exceptional 10.0% |
| Austrians | 98.6 /100 | #82 | Exceptional 10.0% |
| Dutch | 98.6 /100 | #83 | Exceptional 10.0% |
| Immigrants | Israel | 98.5 /100 | #84 | Exceptional 10.0% |
| Immigrants | Romania | 98.5 /100 | #85 | Exceptional 10.0% |
| Immigrants | Norway | 98.4 /100 | #86 | Exceptional 10.0% |
| Egyptians | 98.4 /100 | #87 | Exceptional 10.0% |
| Immigrants | Kuwait | 98.4 /100 | #88 | Exceptional 10.0% |
| Immigrants | France | 98.3 /100 | #89 | Exceptional 10.1% |
| Finns | 97.9 /100 | #90 | Exceptional 10.2% |
| Jordanians | 97.9 /100 | #91 | Exceptional 10.2% |
| Irish | 97.9 /100 | #92 | Exceptional 10.2% |