Bangladeshi vs Immigrants from Norway Receiving Food Stamps
COMPARE
Bangladeshi
Immigrants from Norway
Receiving Food Stamps
Receiving Food Stamps Comparison
Bangladeshis
Immigrants from Norway
15.0%
RECEIVING FOOD STAMPS
0.0/ 100
METRIC RATING
283rd/ 347
METRIC RANK
10.0%
RECEIVING FOOD STAMPS
98.4/ 100
METRIC RATING
86th/ 347
METRIC RANK
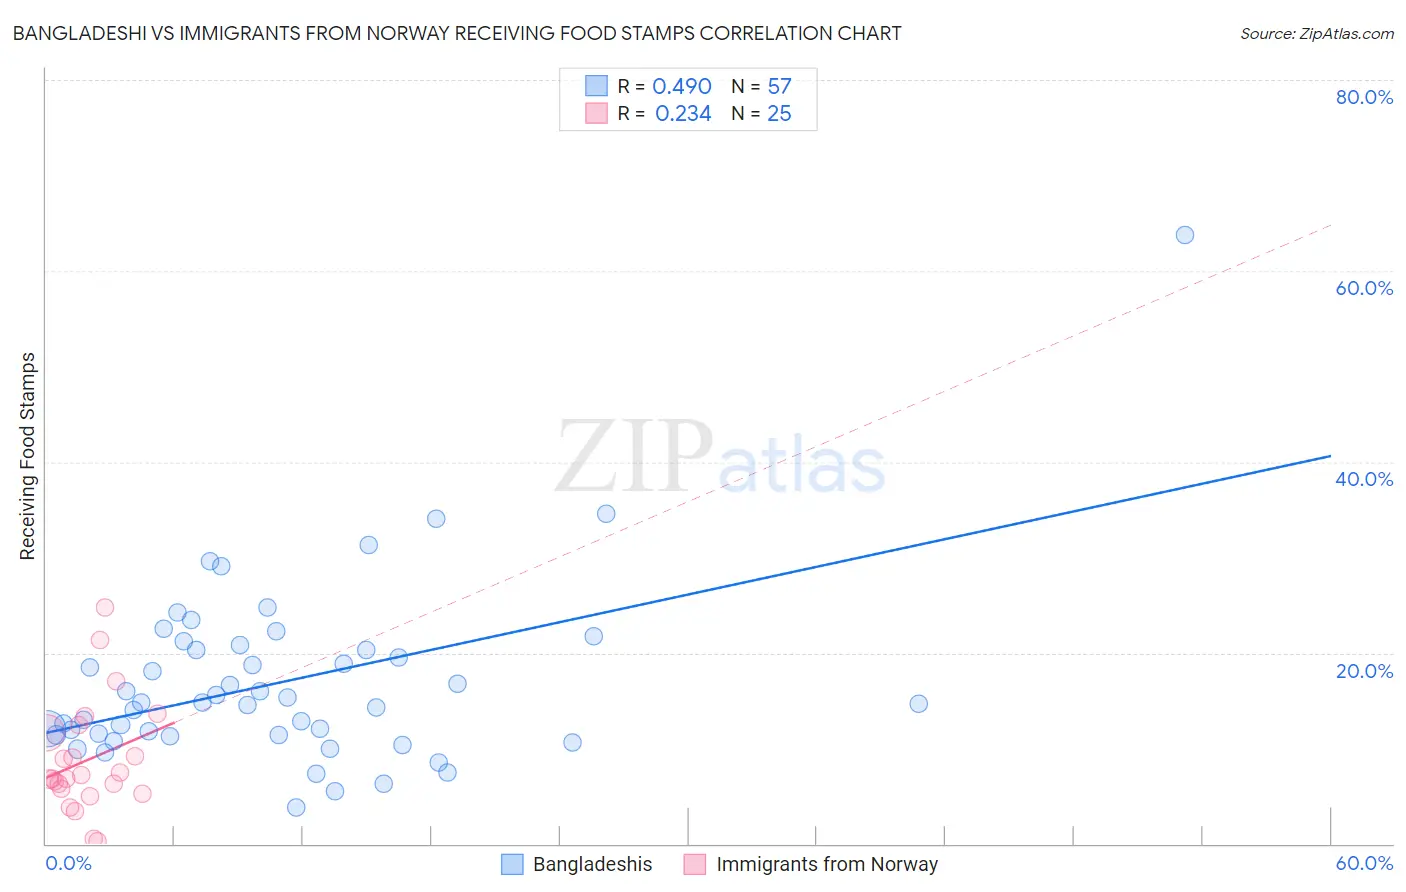
Bangladeshi vs Immigrants from Norway Receiving Food Stamps Correlation Chart
The statistical analysis conducted on geographies consisting of 141,258,280 people shows a moderate positive correlation between the proportion of Bangladeshis and percentage of population receiving government assistance and/or food stamps in the United States with a correlation coefficient (R) of 0.490 and weighted average of 15.0%. Similarly, the statistical analysis conducted on geographies consisting of 116,612,325 people shows a weak positive correlation between the proportion of Immigrants from Norway and percentage of population receiving government assistance and/or food stamps in the United States with a correlation coefficient (R) of 0.234 and weighted average of 10.0%, a difference of 49.9%.
Receiving Food Stamps Correlation Summary
| Measurement | Bangladeshi | Immigrants from Norway |
| Minimum | 3.8% | 0.30% |
| Maximum | 63.8% | 24.7% |
| Range | 60.0% | 24.4% |
| Mean | 16.9% | 8.8% |
| Median | 14.7% | 6.8% |
| Interquartile 25% (IQ1) | 11.4% | 5.5% |
| Interquartile 75% (IQ3) | 20.6% | 12.0% |
| Interquartile Range (IQR) | 9.2% | 6.6% |
| Standard Deviation (Sample) | 9.4% | 5.8% |
| Standard Deviation (Population) | 9.3% | 5.7% |
Similar Demographics by Receiving Food Stamps
Demographics Similar to Bangladeshis by Receiving Food Stamps
In terms of receiving food stamps, the demographic groups most similar to Bangladeshis are Immigrants from Ecuador (15.0%, a difference of 0.010%), Immigrants from Central America (15.0%, a difference of 0.28%), Immigrants from Liberia (15.1%, a difference of 0.39%), African (15.1%, a difference of 0.53%), and Immigrants from Mexico (15.2%, a difference of 0.76%).
| Demographics | Rating | Rank | Receiving Food Stamps |
| Liberians | 0.1 /100 | #276 | Tragic 14.8% |
| Seminole | 0.1 /100 | #277 | Tragic 14.8% |
| Belizeans | 0.1 /100 | #278 | Tragic 14.8% |
| Kiowa | 0.0 /100 | #279 | Tragic 14.9% |
| Ecuadorians | 0.0 /100 | #280 | Tragic 14.9% |
| Spanish American Indians | 0.0 /100 | #281 | Tragic 14.9% |
| Immigrants | Central America | 0.0 /100 | #282 | Tragic 15.0% |
| Bangladeshis | 0.0 /100 | #283 | Tragic 15.0% |
| Immigrants | Ecuador | 0.0 /100 | #284 | Tragic 15.0% |
| Immigrants | Liberia | 0.0 /100 | #285 | Tragic 15.1% |
| Africans | 0.0 /100 | #286 | Tragic 15.1% |
| Immigrants | Mexico | 0.0 /100 | #287 | Tragic 15.2% |
| Immigrants | Belize | 0.0 /100 | #288 | Tragic 15.2% |
| Immigrants | Senegal | 0.0 /100 | #289 | Tragic 15.3% |
| Senegalese | 0.0 /100 | #290 | Tragic 15.4% |
Demographics Similar to Immigrants from Norway by Receiving Food Stamps
In terms of receiving food stamps, the demographic groups most similar to Immigrants from Norway are Egyptian (10.0%, a difference of 0.030%), Immigrants from Kuwait (10.0%, a difference of 0.090%), Immigrants from Romania (10.0%, a difference of 0.10%), Immigrants from Israel (10.0%, a difference of 0.27%), and Immigrants from France (10.1%, a difference of 0.34%).
| Demographics | Rating | Rank | Receiving Food Stamps |
| Laotians | 98.7 /100 | #79 | Exceptional 10.0% |
| Poles | 98.6 /100 | #80 | Exceptional 10.0% |
| Immigrants | England | 98.6 /100 | #81 | Exceptional 10.0% |
| Austrians | 98.6 /100 | #82 | Exceptional 10.0% |
| Dutch | 98.6 /100 | #83 | Exceptional 10.0% |
| Immigrants | Israel | 98.5 /100 | #84 | Exceptional 10.0% |
| Immigrants | Romania | 98.5 /100 | #85 | Exceptional 10.0% |
| Immigrants | Norway | 98.4 /100 | #86 | Exceptional 10.0% |
| Egyptians | 98.4 /100 | #87 | Exceptional 10.0% |
| Immigrants | Kuwait | 98.4 /100 | #88 | Exceptional 10.0% |
| Immigrants | France | 98.3 /100 | #89 | Exceptional 10.1% |
| Finns | 97.9 /100 | #90 | Exceptional 10.2% |
| Jordanians | 97.9 /100 | #91 | Exceptional 10.2% |
| Irish | 97.9 /100 | #92 | Exceptional 10.2% |
| Belgians | 97.7 /100 | #93 | Exceptional 10.2% |