Pueblo vs Black/African American Unemployment Among Ages 30 to 34 years
COMPARE
Pueblo
Black/African American
Unemployment Among Ages 30 to 34 years
Unemployment Among Ages 30 to 34 years Comparison
Pueblo
Blacks/African Americans
8.3%
UNEMPLOYMENT AMONG AGES 30 TO 34 YEARS
0.0/ 100
METRIC RATING
333rd/ 347
METRIC RANK
7.2%
UNEMPLOYMENT AMONG AGES 30 TO 34 YEARS
0.0/ 100
METRIC RATING
318th/ 347
METRIC RANK
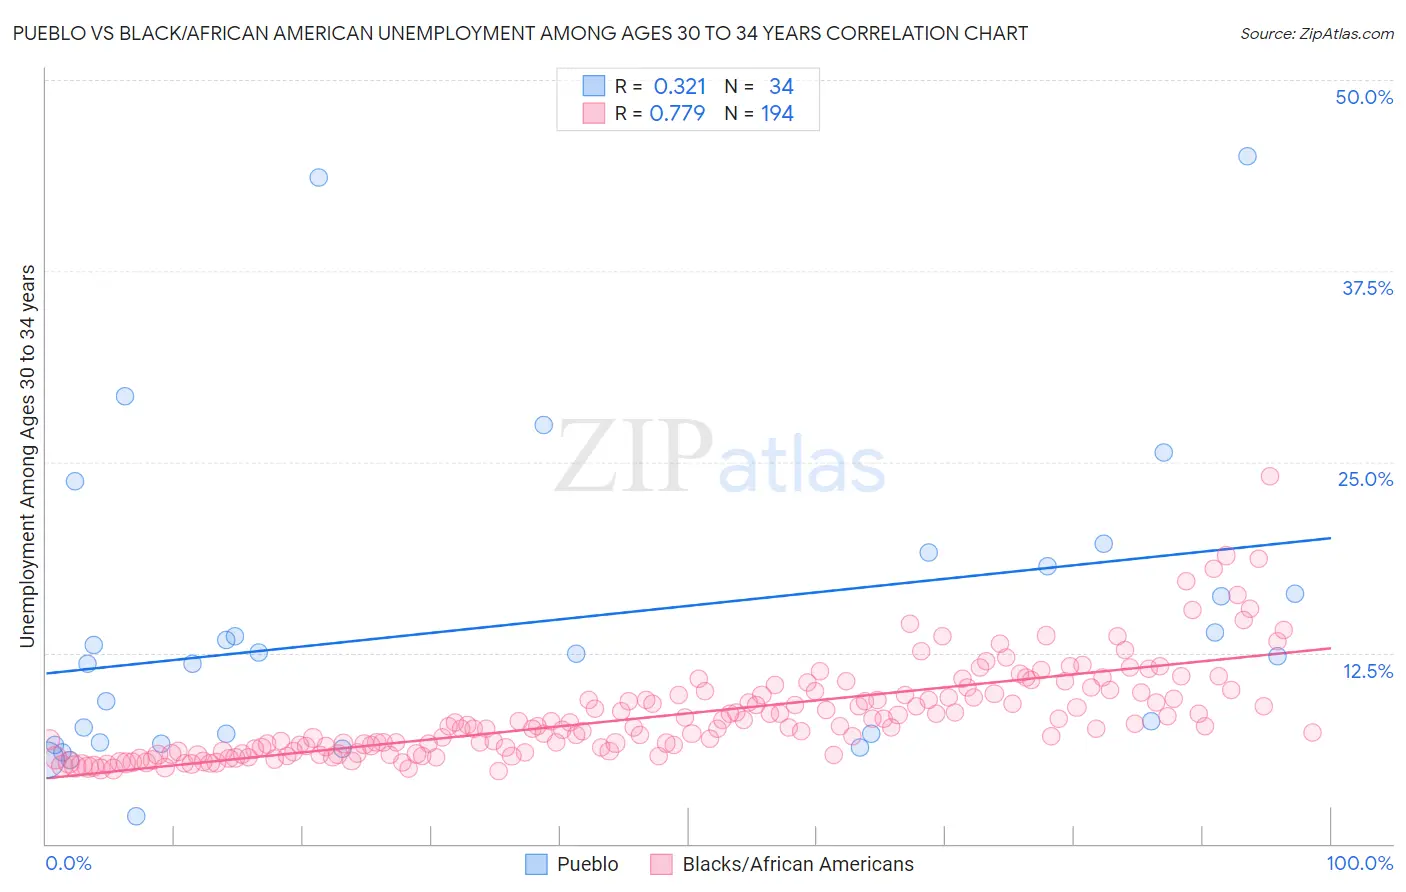
Pueblo vs Black/African American Unemployment Among Ages 30 to 34 years Correlation Chart
The statistical analysis conducted on geographies consisting of 118,023,595 people shows a mild positive correlation between the proportion of Pueblo and unemployment rate among population between the ages 30 and 34 in the United States with a correlation coefficient (R) of 0.321 and weighted average of 8.3%. Similarly, the statistical analysis conducted on geographies consisting of 499,385,483 people shows a strong positive correlation between the proportion of Blacks/African Americans and unemployment rate among population between the ages 30 and 34 in the United States with a correlation coefficient (R) of 0.779 and weighted average of 7.2%, a difference of 15.2%.
Unemployment Among Ages 30 to 34 years Correlation Summary
| Measurement | Pueblo | Black/African American |
| Minimum | 1.8% | 4.7% |
| Maximum | 45.0% | 24.0% |
| Range | 43.2% | 19.3% |
| Mean | 14.4% | 8.4% |
| Median | 12.3% | 7.7% |
| Interquartile 25% (IQ1) | 6.6% | 6.0% |
| Interquartile 75% (IQ3) | 18.2% | 9.8% |
| Interquartile Range (IQR) | 11.6% | 3.8% |
| Standard Deviation (Sample) | 10.2% | 3.1% |
| Standard Deviation (Population) | 10.0% | 3.1% |
Demographics Similar to Pueblo and Blacks/African Americans by Unemployment Among Ages 30 to 34 years
In terms of unemployment among ages 30 to 34 years, the demographic groups most similar to Pueblo are Native/Alaskan (8.2%, a difference of 0.43%), Alaska Native (8.5%, a difference of 2.7%), Sioux (8.0%, a difference of 3.1%), Shoshone (7.9%, a difference of 4.5%), and Cheyenne (7.8%, a difference of 5.5%). Similarly, the demographic groups most similar to Blacks/African Americans are Guyanese (7.2%, a difference of 0.060%), Cape Verdean (7.2%, a difference of 0.090%), Immigrants from Cabo Verde (7.2%, a difference of 0.10%), Houma (7.2%, a difference of 0.37%), and Immigrants from Guyana (7.2%, a difference of 0.38%).
| Demographics | Rating | Rank | Unemployment Among Ages 30 to 34 years |
| Aleuts | 0.0 /100 | #315 | Tragic 7.1% |
| Houma | 0.0 /100 | #316 | Tragic 7.2% |
| Immigrants | Cabo Verde | 0.0 /100 | #317 | Tragic 7.2% |
| Blacks/African Americans | 0.0 /100 | #318 | Tragic 7.2% |
| Guyanese | 0.0 /100 | #319 | Tragic 7.2% |
| Cape Verdeans | 0.0 /100 | #320 | Tragic 7.2% |
| Immigrants | Guyana | 0.0 /100 | #321 | Tragic 7.2% |
| Marshallese | 0.0 /100 | #322 | Tragic 7.2% |
| Immigrants | Yemen | 0.0 /100 | #323 | Tragic 7.3% |
| Immigrants | Dominica | 0.0 /100 | #324 | Tragic 7.3% |
| Apache | 0.0 /100 | #325 | Tragic 7.3% |
| Dominicans | 0.0 /100 | #326 | Tragic 7.7% |
| Immigrants | Dominican Republic | 0.0 /100 | #327 | Tragic 7.7% |
| Chippewa | 0.0 /100 | #328 | Tragic 7.8% |
| Cheyenne | 0.0 /100 | #329 | Tragic 7.8% |
| Shoshone | 0.0 /100 | #330 | Tragic 7.9% |
| Sioux | 0.0 /100 | #331 | Tragic 8.0% |
| Natives/Alaskans | 0.0 /100 | #332 | Tragic 8.2% |
| Pueblo | 0.0 /100 | #333 | Tragic 8.3% |
| Alaska Natives | 0.0 /100 | #334 | Tragic 8.5% |
| Puerto Ricans | 0.0 /100 | #335 | Tragic 8.9% |