Pueblo vs Black/African American Doctorate Degree
COMPARE
Pueblo
Black/African American
Doctorate Degree
Doctorate Degree Comparison
Pueblo
Blacks/African Americans
1.7%
DOCTORATE DEGREE
14.2/ 100
METRIC RATING
214th/ 347
METRIC RANK
1.4%
DOCTORATE DEGREE
0.3/ 100
METRIC RATING
291st/ 347
METRIC RANK
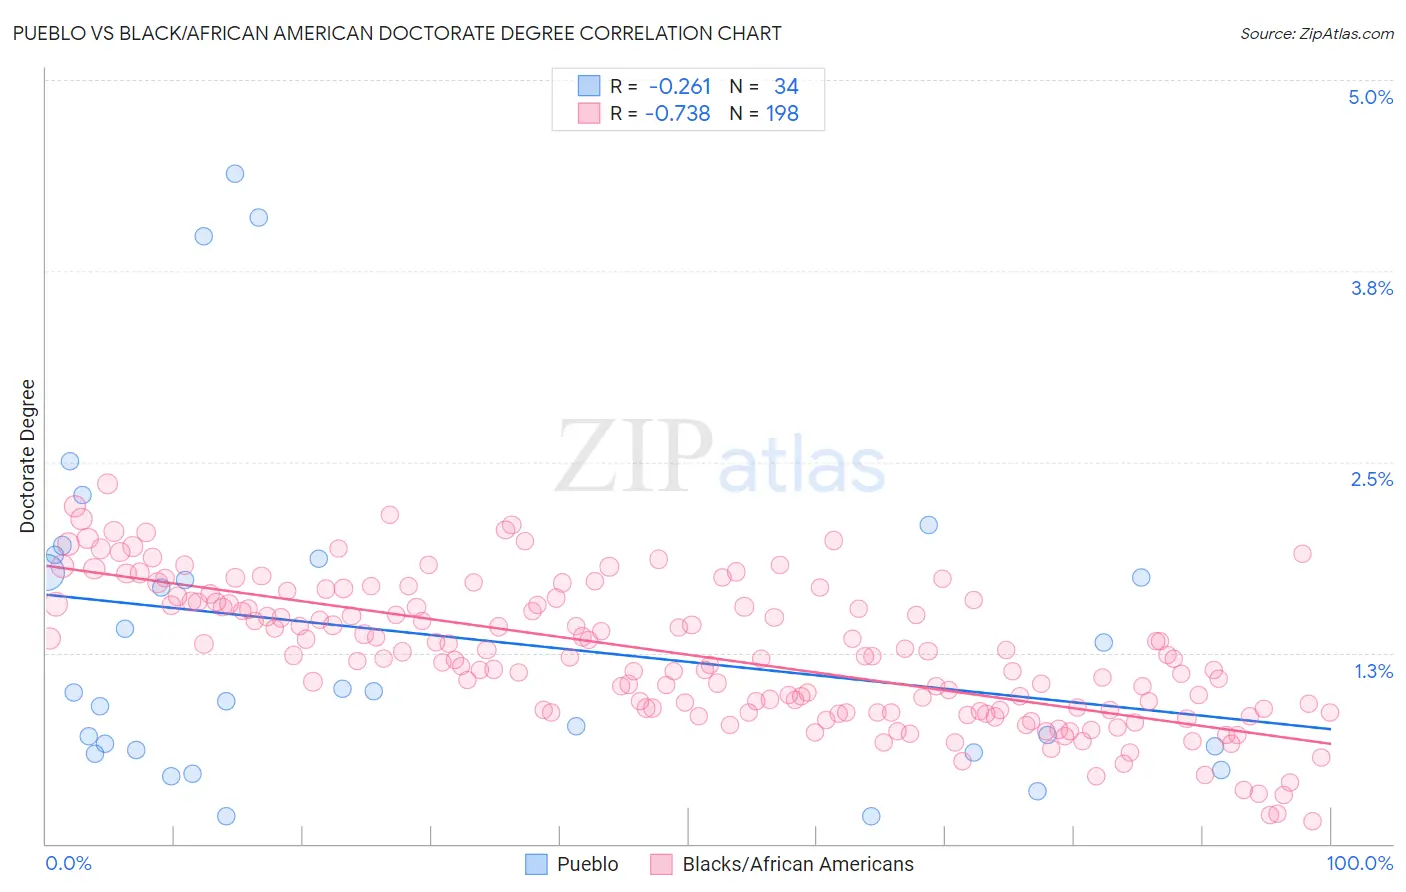
Pueblo vs Black/African American Doctorate Degree Correlation Chart
The statistical analysis conducted on geographies consisting of 119,278,004 people shows a weak negative correlation between the proportion of Pueblo and percentage of population with at least doctorate degree education in the United States with a correlation coefficient (R) of -0.261 and weighted average of 1.7%. Similarly, the statistical analysis conducted on geographies consisting of 542,418,709 people shows a strong negative correlation between the proportion of Blacks/African Americans and percentage of population with at least doctorate degree education in the United States with a correlation coefficient (R) of -0.738 and weighted average of 1.4%, a difference of 19.1%.
Doctorate Degree Correlation Summary
| Measurement | Pueblo | Black/African American |
| Minimum | 0.18% | 0.15% |
| Maximum | 4.4% | 2.4% |
| Range | 4.2% | 2.2% |
| Mean | 1.4% | 1.2% |
| Median | 0.99% | 1.2% |
| Interquartile 25% (IQ1) | 0.62% | 0.87% |
| Interquartile 75% (IQ3) | 1.9% | 1.6% |
| Interquartile Range (IQR) | 1.3% | 0.71% |
| Standard Deviation (Sample) | 1.1% | 0.46% |
| Standard Deviation (Population) | 1.1% | 0.46% |
Similar Demographics by Doctorate Degree
Demographics Similar to Pueblo by Doctorate Degree
In terms of doctorate degree, the demographic groups most similar to Pueblo are Korean (1.7%, a difference of 0.010%), Alaskan Athabascan (1.7%, a difference of 0.14%), Immigrants from South Eastern Asia (1.7%, a difference of 0.15%), Immigrants from Burma/Myanmar (1.7%, a difference of 0.24%), and Immigrants from Armenia (1.7%, a difference of 0.28%).
| Demographics | Rating | Rank | Doctorate Degree |
| Yugoslavians | 17.1 /100 | #207 | Poor 1.7% |
| Colombians | 16.1 /100 | #208 | Poor 1.7% |
| Immigrants | Western Africa | 15.4 /100 | #209 | Poor 1.7% |
| Tongans | 15.1 /100 | #210 | Poor 1.7% |
| Immigrants | Armenia | 15.1 /100 | #211 | Poor 1.7% |
| Immigrants | South Eastern Asia | 14.7 /100 | #212 | Poor 1.7% |
| Koreans | 14.2 /100 | #213 | Poor 1.7% |
| Pueblo | 14.2 /100 | #214 | Poor 1.7% |
| Alaskan Athabascans | 13.8 /100 | #215 | Poor 1.7% |
| Immigrants | Burma/Myanmar | 13.5 /100 | #216 | Poor 1.7% |
| Spanish Americans | 12.9 /100 | #217 | Poor 1.7% |
| Tlingit-Haida | 11.9 /100 | #218 | Poor 1.7% |
| Immigrants | Iraq | 10.7 /100 | #219 | Poor 1.7% |
| Immigrants | Uruguay | 9.2 /100 | #220 | Tragic 1.7% |
| Immigrants | Nonimmigrants | 8.8 /100 | #221 | Tragic 1.7% |
Demographics Similar to Blacks/African Americans by Doctorate Degree
In terms of doctorate degree, the demographic groups most similar to Blacks/African Americans are Alaska Native (1.4%, a difference of 0.17%), Choctaw (1.4%, a difference of 0.23%), Cape Verdean (1.4%, a difference of 0.24%), Immigrants from El Salvador (1.4%, a difference of 0.38%), and Cajun (1.5%, a difference of 0.56%).
| Demographics | Rating | Rank | Doctorate Degree |
| Jamaicans | 0.3 /100 | #284 | Tragic 1.5% |
| Malaysians | 0.3 /100 | #285 | Tragic 1.5% |
| Cherokee | 0.3 /100 | #286 | Tragic 1.5% |
| Cajuns | 0.3 /100 | #287 | Tragic 1.5% |
| Immigrants | El Salvador | 0.3 /100 | #288 | Tragic 1.4% |
| Cape Verdeans | 0.3 /100 | #289 | Tragic 1.4% |
| Choctaw | 0.3 /100 | #290 | Tragic 1.4% |
| Blacks/African Americans | 0.3 /100 | #291 | Tragic 1.4% |
| Alaska Natives | 0.3 /100 | #292 | Tragic 1.4% |
| Immigrants | Yemen | 0.2 /100 | #293 | Tragic 1.4% |
| Samoans | 0.2 /100 | #294 | Tragic 1.4% |
| Guatemalans | 0.2 /100 | #295 | Tragic 1.4% |
| Immigrants | Ecuador | 0.2 /100 | #296 | Tragic 1.4% |
| Tsimshian | 0.2 /100 | #297 | Tragic 1.4% |
| Puerto Ricans | 0.1 /100 | #298 | Tragic 1.4% |