Polish vs Panamanian College, 1 year or more
COMPARE
Polish
Panamanian
College, 1 year or more
College, 1 year or more Comparison
Poles
Panamanians
60.7%
COLLEGE, 1 YEAR OR MORE
82.8/ 100
METRIC RATING
142nd/ 347
METRIC RANK
58.3%
COLLEGE, 1 YEAR OR MORE
19.2/ 100
METRIC RATING
204th/ 347
METRIC RANK
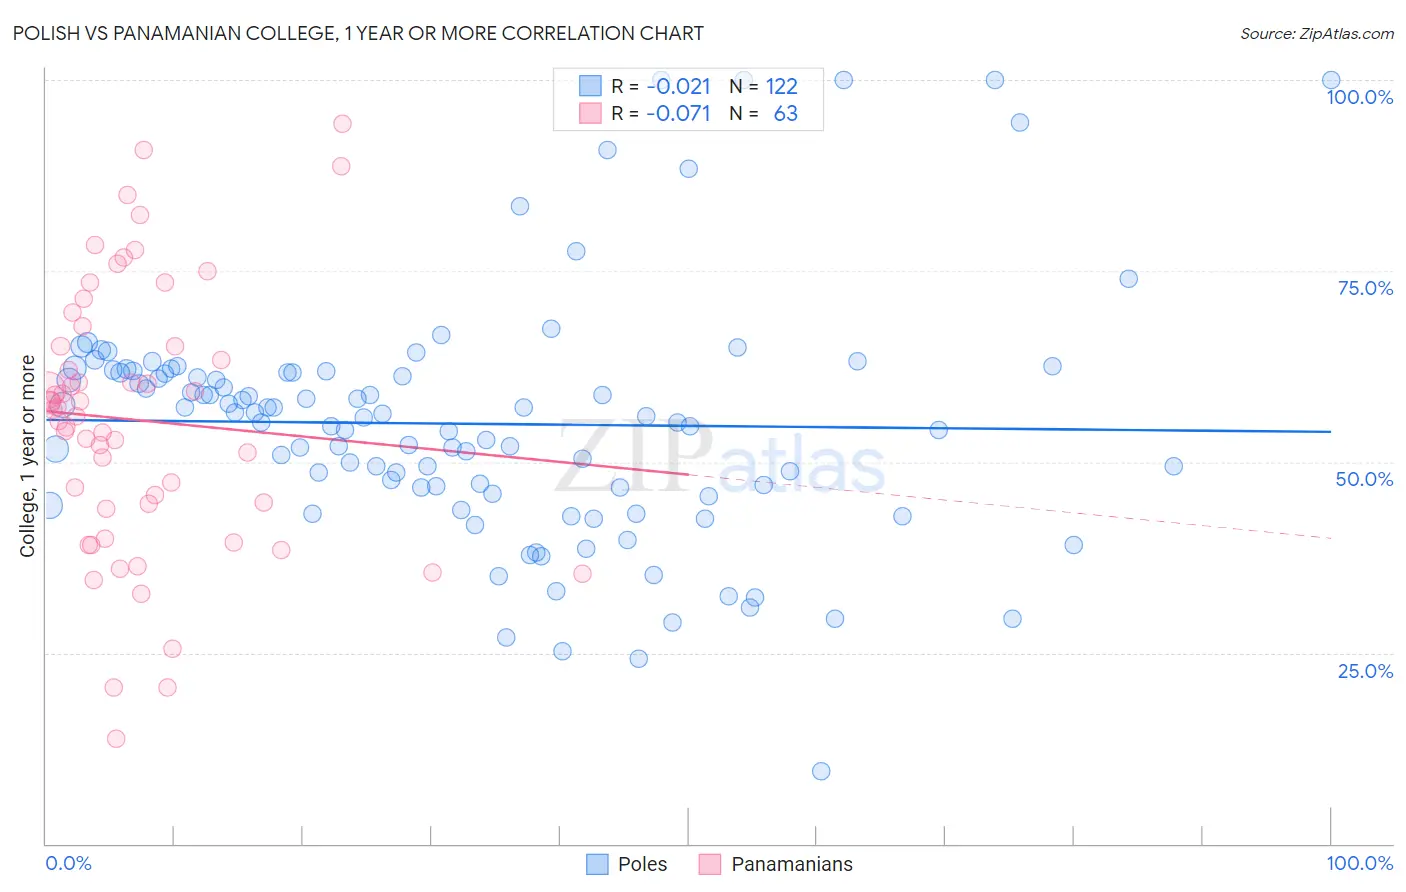
Polish vs Panamanian College, 1 year or more Correlation Chart
The statistical analysis conducted on geographies consisting of 560,585,948 people shows no correlation between the proportion of Poles and percentage of population with at least college, 1 year or more education in the United States with a correlation coefficient (R) of -0.021 and weighted average of 60.7%. Similarly, the statistical analysis conducted on geographies consisting of 281,250,786 people shows a slight negative correlation between the proportion of Panamanians and percentage of population with at least college, 1 year or more education in the United States with a correlation coefficient (R) of -0.071 and weighted average of 58.3%, a difference of 4.1%.
College, 1 year or more Correlation Summary
| Measurement | Polish | Panamanian |
| Minimum | 9.5% | 13.8% |
| Maximum | 100.0% | 94.2% |
| Range | 90.5% | 80.4% |
| Mean | 55.0% | 55.5% |
| Median | 55.9% | 56.8% |
| Interquartile 25% (IQ1) | 46.6% | 43.9% |
| Interquartile 75% (IQ3) | 61.7% | 65.2% |
| Interquartile Range (IQR) | 15.1% | 21.3% |
| Standard Deviation (Sample) | 16.1% | 17.5% |
| Standard Deviation (Population) | 16.0% | 17.4% |
Similar Demographics by College, 1 year or more
Demographics Similar to Poles by College, 1 year or more
In terms of college, 1 year or more, the demographic groups most similar to Poles are Canadian (60.6%, a difference of 0.010%), Immigrants from Afghanistan (60.7%, a difference of 0.030%), Iraqi (60.7%, a difference of 0.050%), Czech (60.6%, a difference of 0.080%), and Immigrants from Eritrea (60.7%, a difference of 0.14%).
| Demographics | Rating | Rank | College, 1 year or more |
| Immigrants | Uganda | 87.4 /100 | #135 | Excellent 60.9% |
| Basques | 87.2 /100 | #136 | Excellent 60.9% |
| Slovenes | 86.5 /100 | #137 | Excellent 60.9% |
| Taiwanese | 84.3 /100 | #138 | Excellent 60.7% |
| Immigrants | Eritrea | 84.3 /100 | #139 | Excellent 60.7% |
| Iraqis | 83.3 /100 | #140 | Excellent 60.7% |
| Immigrants | Afghanistan | 83.1 /100 | #141 | Excellent 60.7% |
| Poles | 82.8 /100 | #142 | Excellent 60.7% |
| Canadians | 82.7 /100 | #143 | Excellent 60.6% |
| Czechs | 81.9 /100 | #144 | Excellent 60.6% |
| Slavs | 81.1 /100 | #145 | Excellent 60.6% |
| Scottish | 80.2 /100 | #146 | Excellent 60.5% |
| Immigrants | Kenya | 79.1 /100 | #147 | Good 60.5% |
| Kenyans | 79.0 /100 | #148 | Good 60.5% |
| Brazilians | 79.0 /100 | #149 | Good 60.5% |
Demographics Similar to Panamanians by College, 1 year or more
In terms of college, 1 year or more, the demographic groups most similar to Panamanians are Immigrants from Zaire (58.3%, a difference of 0.050%), Immigrants from Vietnam (58.2%, a difference of 0.090%), Ghanaian (58.4%, a difference of 0.14%), Senegalese (58.2%, a difference of 0.21%), and Immigrants from South America (58.4%, a difference of 0.23%).
| Demographics | Rating | Rank | College, 1 year or more |
| Immigrants | Thailand | 26.0 /100 | #197 | Fair 58.6% |
| Immigrants | South Eastern Asia | 25.1 /100 | #198 | Fair 58.5% |
| Slovaks | 24.6 /100 | #199 | Fair 58.5% |
| Spanish | 24.2 /100 | #200 | Fair 58.5% |
| Nigerians | 23.0 /100 | #201 | Fair 58.5% |
| Immigrants | South America | 21.9 /100 | #202 | Fair 58.4% |
| Ghanaians | 20.9 /100 | #203 | Fair 58.4% |
| Panamanians | 19.2 /100 | #204 | Poor 58.3% |
| Immigrants | Zaire | 18.7 /100 | #205 | Poor 58.3% |
| Immigrants | Vietnam | 18.2 /100 | #206 | Poor 58.2% |
| Senegalese | 16.9 /100 | #207 | Poor 58.2% |
| Immigrants | Uruguay | 15.2 /100 | #208 | Poor 58.1% |
| Immigrants | Middle Africa | 14.0 /100 | #209 | Poor 58.0% |
| Tsimshian | 13.5 /100 | #210 | Poor 57.9% |
| Immigrants | Nigeria | 13.3 /100 | #211 | Poor 57.9% |