Yuman vs Immigrants from Latvia Receiving Food Stamps
COMPARE
Yuman
Immigrants from Latvia
Receiving Food Stamps
Receiving Food Stamps Comparison
Yuman
Immigrants from Latvia
20.2%
RECEIVING FOOD STAMPS
0.0/ 100
METRIC RATING
334th/ 347
METRIC RANK
10.3%
RECEIVING FOOD STAMPS
96.8/ 100
METRIC RATING
103rd/ 347
METRIC RANK
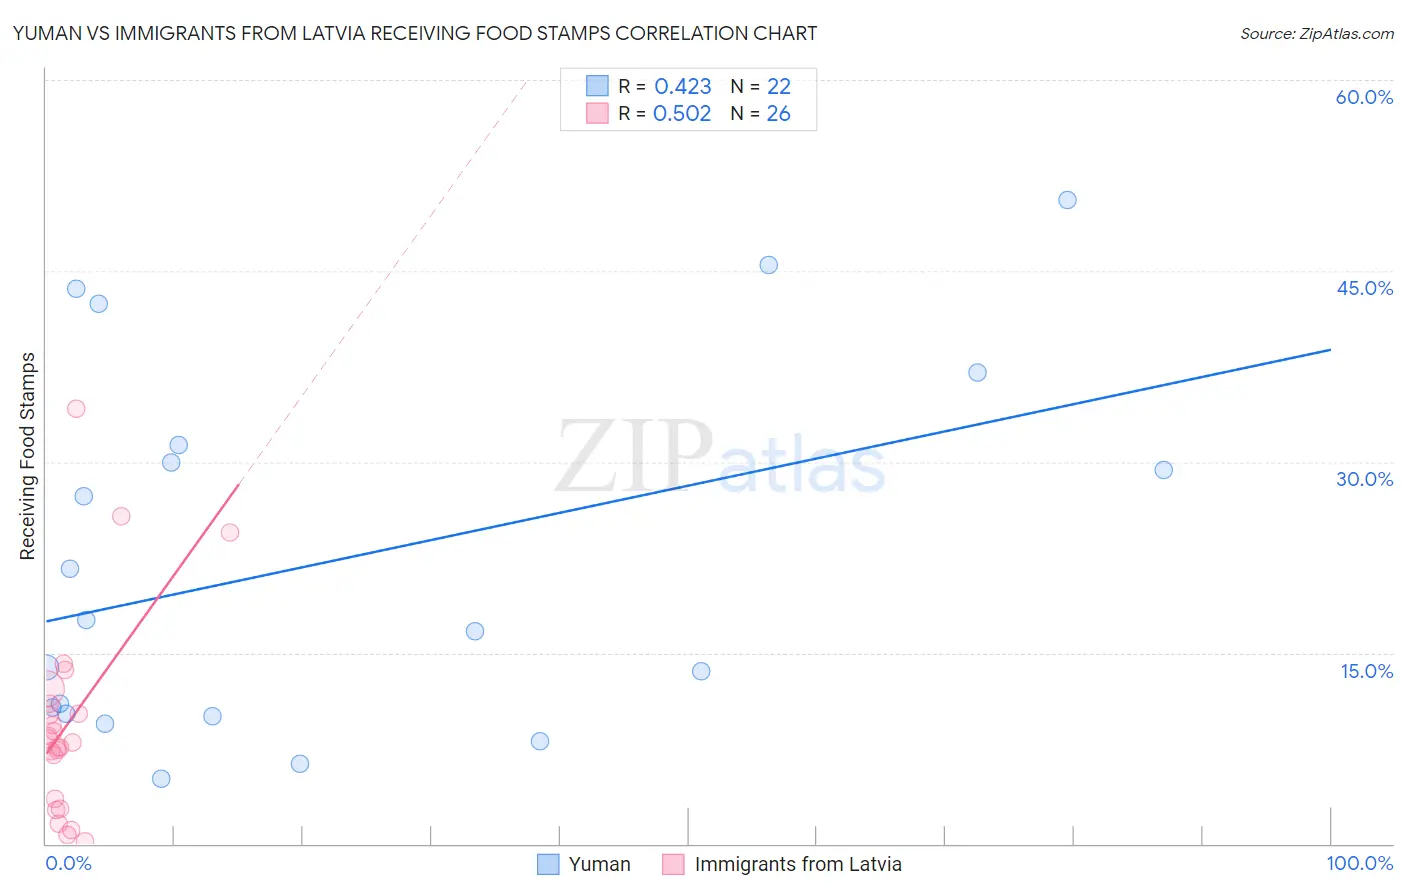
Yuman vs Immigrants from Latvia Receiving Food Stamps Correlation Chart
The statistical analysis conducted on geographies consisting of 40,663,437 people shows a moderate positive correlation between the proportion of Yuman and percentage of population receiving government assistance and/or food stamps in the United States with a correlation coefficient (R) of 0.423 and weighted average of 20.2%. Similarly, the statistical analysis conducted on geographies consisting of 113,573,789 people shows a substantial positive correlation between the proportion of Immigrants from Latvia and percentage of population receiving government assistance and/or food stamps in the United States with a correlation coefficient (R) of 0.502 and weighted average of 10.3%, a difference of 95.5%.
Receiving Food Stamps Correlation Summary
| Measurement | Yuman | Immigrants from Latvia |
| Minimum | 5.1% | 0.20% |
| Maximum | 50.6% | 34.2% |
| Range | 45.5% | 34.0% |
| Mean | 22.3% | 9.5% |
| Median | 17.1% | 8.1% |
| Interquartile 25% (IQ1) | 10.2% | 3.5% |
| Interquartile 75% (IQ3) | 31.3% | 11.0% |
| Interquartile Range (IQR) | 21.1% | 7.5% |
| Standard Deviation (Sample) | 14.3% | 8.0% |
| Standard Deviation (Population) | 14.0% | 7.8% |
Similar Demographics by Receiving Food Stamps
Demographics Similar to Yuman by Receiving Food Stamps
In terms of receiving food stamps, the demographic groups most similar to Yuman are Inupiat (20.1%, a difference of 0.86%), Pueblo (19.9%, a difference of 1.6%), Immigrants from Cuba (20.8%, a difference of 2.9%), Immigrants from Caribbean (19.6%, a difference of 3.1%), and Navajo (21.1%, a difference of 4.1%).
| Demographics | Rating | Rank | Receiving Food Stamps |
| Apache | 0.0 /100 | #327 | Tragic 18.3% |
| Colville | 0.0 /100 | #328 | Tragic 18.3% |
| Immigrants | Dominica | 0.0 /100 | #329 | Tragic 18.4% |
| Pima | 0.0 /100 | #330 | Tragic 19.0% |
| Immigrants | Caribbean | 0.0 /100 | #331 | Tragic 19.6% |
| Pueblo | 0.0 /100 | #332 | Tragic 19.9% |
| Inupiat | 0.0 /100 | #333 | Tragic 20.1% |
| Yuman | 0.0 /100 | #334 | Tragic 20.2% |
| Immigrants | Cuba | 0.0 /100 | #335 | Tragic 20.8% |
| Navajo | 0.0 /100 | #336 | Tragic 21.1% |
| Cape Verdeans | 0.0 /100 | #337 | Tragic 21.1% |
| Dominicans | 0.0 /100 | #338 | Tragic 21.4% |
| Yakama | 0.0 /100 | #339 | Tragic 21.4% |
| Tohono O'odham | 0.0 /100 | #340 | Tragic 21.5% |
| Hopi | 0.0 /100 | #341 | Tragic 21.6% |
Demographics Similar to Immigrants from Latvia by Receiving Food Stamps
In terms of receiving food stamps, the demographic groups most similar to Immigrants from Latvia are Immigrants from Hungary (10.3%, a difference of 0.010%), Immigrants from Europe (10.3%, a difference of 0.10%), Immigrants from Western Europe (10.3%, a difference of 0.18%), Palestinian (10.3%, a difference of 0.18%), and Serbian (10.3%, a difference of 0.31%).
| Demographics | Rating | Rank | Receiving Food Stamps |
| Welsh | 97.3 /100 | #96 | Exceptional 10.3% |
| Czechoslovakians | 97.2 /100 | #97 | Exceptional 10.3% |
| Immigrants | Egypt | 97.1 /100 | #98 | Exceptional 10.3% |
| Serbians | 97.0 /100 | #99 | Exceptional 10.3% |
| Immigrants | Western Europe | 96.9 /100 | #100 | Exceptional 10.3% |
| Palestinians | 96.9 /100 | #101 | Exceptional 10.3% |
| Immigrants | Europe | 96.8 /100 | #102 | Exceptional 10.3% |
| Immigrants | Latvia | 96.8 /100 | #103 | Exceptional 10.3% |
| Immigrants | Hungary | 96.7 /100 | #104 | Exceptional 10.3% |
| Immigrants | Malaysia | 96.5 /100 | #105 | Exceptional 10.4% |
| Immigrants | Italy | 96.4 /100 | #106 | Exceptional 10.4% |
| Koreans | 96.3 /100 | #107 | Exceptional 10.4% |
| Carpatho Rusyns | 96.2 /100 | #108 | Exceptional 10.4% |
| Immigrants | Pakistan | 96.2 /100 | #109 | Exceptional 10.4% |
| Pakistanis | 95.9 /100 | #110 | Exceptional 10.4% |